Search Header Logo
Linear Regression

Linear Regression

Assessment

Presentation

•

Mathematics

•

KG

•

Medium

•
CCSS
8.EE.C.8C, HSS.ID.C.9, HSS.ID.B.5

+5

Standards-aligned

Created by

Tomika Briscoe

Used 18+ times

FREE Resource

11 Slides • 15 Questions

1

​Linear Regression

2

Multiple Choice

As x increases, y increases

1

A) correlation coefficient

2

B) causation

3

C) positive correlation

4

D) negative correlation

3

Multiple Choice

As x increases, y decreases.

1

A) no correlation

2

B) negative correlation

3

C) correlation coefficient

4

D) positive correlation

4

Multiple Choice

Average fat intake per citizen of a country and average cancer rate of a country.  r=.73r=.73  

1

strong positive

2

strong negative

3

weak positive

4

weak negative

5

I CAN......
  • create scatterplot on graphing calculator (DESMOS)

  • Determine line of best fit using a graphing calculator (linear regression.

  • Make a prediction using linear regression equation.

media

6

Line of Best Fit

A line of best fit (or trend line) is a straight line that best represents the data on a scatter plot.

  • Always represents the general trend of the of the data.

media
media

​aka Linear Regression Equation

7

Lines of Best Fit

The best line of fit goes through the center of the data, following the trend of the scatterplot

media

8

media
media

​Find the linear regression equation for the data set:

  1. Click the plus sign on DESMOS Graphing Calculator

  2. Click "table"

  3. Enter the values​

  4. On the next line​ under the table, type y1~mx1+b

  5. Desmos will give you m and b. Plug them into y=mx1+b to get your equation! 

media
media
media

Equation is y=3x-1

9

Multiple Choice

Question image

A restaurant sells pizza for the prices in the data table. Calculate the linear regression equation of the data.

1

y = 1.5x + 12

2

y = 12x + 1.5

3

y = 0.67x - 8

4

y = -8x + 0.67

10

y = 1.5x + 12

media

11

Multiple Choice

Question image

What is the line of best fit?

1

f(x)= 5x+1.82

2

cannot be determined

3

f(x)= 1.82x + 5.02

4

f(x)= 1.1x + 4.2

12

Equation: y=1.82x+5.02

media

13

Multiple Choice

Question image
The chart below tracts starting salaries for health care workers since the year 2000. Using linear regression, find the equation of best fit. Round decimals to 3 places.
1

y = 839.721x + 27541.812

2

y = 27541.812x - 839.721

3

y = 27541.812x + 839.721

4

y = 839.721x - 27541.812

14

Multiple Choice

Question image
The linear regression equation is y = 61.93x - 1.79.  Use the equation to predict how far this person will travel after 10 hours of driving.
1

10 miles

2

617.5 miles

3

0.19 miles

4

500 miles

15

​Make predictions using the Linear regression equation
media

​1.) Find linear regression equation.

2. ) Substitute value in for x.

3.) Find predication for y.

4.) Answer the question

16

y=61.93x - 1.79


y=61.93(10) - 1.79


= 619.3 - 1.79


= 617.5

​The person is predicted to travel 617.5 miles in 10 hours.

17

Multiple Choice

Question image
The linear regression equation for the data is  y = 1.5x + 12.  Use the equation to predict the cost of a pizza that has 8 toppings.
1

$8

2

$12

3

$24

4

$28

18

​Interpretation of Linear Regression Equation

media

19

Multiple Choice

Question image

The linear regression equation for the data is y = 1.5x + 12. Interpret the slope of the equation.

1

The slope is (0, 1.5). It means that a pizza with 0 toppings will cost 1.5 dollars.

2

The slope is 1.5. It means that it costs 1.5 dollars per topping.

3

There are 1.5 toppings.

4

There are 1.5 pizzas.

20

media

Which statement below is the best interpretation of the y-intercept for the best-fit line?

media
media

21

Multiple Choice

Question image

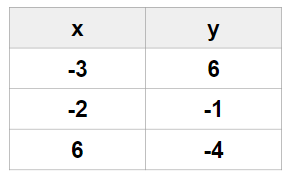
A person travels by car. They record their miles driven in a data table. Calculate the linear regression equation of this data.

1

y = 61.93x - 1.79

2

y = -1.79x + 61.93

3

y = 0.016x + 0.03

4

y = 0.03x + 0.016

22

Multiple Choice

Question image

Write the linear regression equation for the following data points. Round to the nearest hundredth.

1

y=−0.83x+0.61y=-0.83x+0.61

2

y=−0.83x+0.63y=-0.83x+0.63

3

y=0.83x+−0.8y=0.83x+-0.8

4

y = -0.828767x + 0.609589

23

Multiple Choice

Question image
If Joe worked 30 hours, how much is he expected to earn?
1

$600

2

$200

3

$1000

4

$800

24

Multiple Choice

Question image
Make a prediction for a resting heart rate after 6 hours of exercise a week.
1

6

2

50

3

55

4

59

25

Multiple Choice

Exit Ticket: What is the correlation coefficient and linear regression of the data set: (1,7) (2,4) (3,-1) (8,-9) (6,-3) (-1,10).

1

r = .98 & y = 7.9x - 2.1

2

r = .97 & y = 7.9x - 2.1

3

r = .95 & y = 7.9x - 2.1

4

r = .98 & y = -2.1x + 7.9

5

r = .97 & y = -2.1x + 7.9

26

Open Ended

Question image

How well did you understand today's lesson? One of your classmates is absent today.  Write down one item that they should know based upon today’s lesson.

pattern-tertiary

​Linear Regression

Show answer

Auto Play

Slide 1 / 26

SLIDE