Search Header Logo
U5D2 Evaluating Functions

U5D2 Evaluating Functions

Assessment

Presentation

•

Mathematics

•

7th Grade

•

Hard

Created by

PAUL YOUNG

FREE Resource

28 Slides • 29 Questions

1

Evaluate Functions Review
media

2

Match

Vocab Review

Maximum

Minimum

Increasing

Decreasing

Constant

Highest point of a function

Lowest point of a function

Graph is rising from left to right

Graph is going down left to right

The function is a horizontal line

3

Increasing, Decreasing, Positive, and Negative Intervals

How do I find where a graph is increasing, decreasing, positive, or negative?

4

media
media

5

Function Review

Algebra Unit 1b


Please make sure to have your math

notebook and pencil ready to go.

media

6

Parts of a Function Graph

by B. Cox

7

Remember, to evaluate functions, substitute the given value in for x.
  • For example, if

    • f(x) = 4x - 8, then f(3) = 4(3) - 8, which means f(3) = 4

    • g(x) = x2 + 3x, then g(-1) = (-1)2 + 3(-1), which means f(-1) = -2

8

​Intercepts

Intercepts are the points where a function crosses an axis.

​

The y - intercept is the y-value of the point where the graph crosses the y - axis.

​

​The x - intercept(s) are the

x-value(s) of the point(s) where the graph crosses the x - axis.

media

9

Poll

What zone are you in today?

10

Multiple Choice

Question image

Which point below represents the y - intercept?

1

B

2

C

3

E

11

Interval Notation

  • ​Shows a group of values on a graph

  • Uses brackets, parenthesis, and the infinity symbol​

Subject | Subject

Some text here about the topic of discussion

media

12

Multiple Select

Question image

Which point(s) below represents the x - intercept(s)?

Check all that apply

1

B

2

C

3

D

4

E

13

media

14

​Absolute Maximum and Minimum

​The absolute maximum and absolute minimum are the coordinates of the highest and lowest points on a function graph.

media

15

Evaluate from Graphs
  • Are you finding x or y?

  • If it's f(#) you are finding y and know what x is

  • If it's f(x) = # you are finding x and know what y is

media

16

Relative Maximum and Minimum

Relative maximum(s) and relative minimum(s) are the coordinates of the highest and lowest points in a particular region of afunction graph.

media

17

Outcomes
  • I can analyze graphs in order to identify domain and range.

  • I can analyze graphs, tables, and stories in order to interpret key features in terms of the quantities that the function it represents.

18

Multiple Choice

Question image

Which point below represents the absolute maximum point on the graph?

1

A

2

D

3

F

4

G

19

Example:
media
media

20

Multiple Choice

Question image

Which point below represents the absolute minimum point on the graph?

1

A

2

D

3

F

4

G

21

Key Features

on a Graph

Intervals of

increase, decrease and constant


X- and Y-Intercepts


Minimum and Maximum

media

22

Multiple Choice

Question image

Which point below represents a relative maximum point on the graph?

1

A

2

D

3

F

4

G

23

Multiple Choice

What is f(6) for the function f(x)=3x-8

1

-8

2

10

3

-144

4

answer not here

24

Multiple Choice

Question image

Which point below represents a relative minimum point on the graph?

1

A

2

D

3

F

4

G

25

Intervals

When x values go up..

  • Increasing: Y values go UP

  • Decreasing: Y values goes DOWN

  • Constant: Y values stay the SAME

media

26

Increasing and Decreasing Intervals

When reading a function graph, we read it from left to right.

​

​An increasing interval is a section of the graph that starts at a minimum point and ends at a maximum point.

media

27

media

28

Increasing and Decreasing Intervals

​A decreasing interval is a section of the graph that starts at a maximum point and ends at a minimum point.

​

​The points where the function graph switches from increasing to decreasing or vice versa are called turning points.

media

29

Multiple Choice

Question image

Which domain describes the INCREASING interval?

1

0 < x < 2

2

2 < x < 4

3

8 < x < 10

30

Multiple Choice

Question image

Which interval(s) below represents an increasing interval?

1

A to D

2

D to F

3

F to G

31

Multiple Choice

Question image
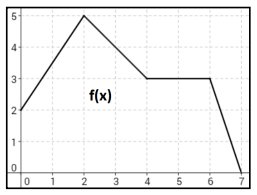
What is f(2)?
1

-4

2

8

3

0

4

5

32

Multiple Select

Question image

Which interval(s) below represents a decreasing interval? (Check all that apply)

1

A to D

2

D to F

3

F to G

33

Multiple Choice

Question image

Which domain describes the DECREASING interval?

1

0 < x < 2

2

2 < x < 4

3

8 < x < 10

34

Positive and Negative Intervals

​A positive interval is a section of the graph that sits above the x-axis.

​

A negative interval is a section of the graph that sits below the x-axis.

media

35

media

36

Multiple Select

Question image

Which interval(s) below represents a positive interval? (Check all that apply)

1

A to B

2

B to E

3

E to G

37

Multiple Choice

Question image

Which domain describes the CONSTANT interval?

1

0 < x < 2

2

2 < x < 4

3

8 < x < 10

38

Multiple Choice

Question image

Which interval(s) below represents a negative interval?

1

A to B

2

B to E

3

E to G

39

Multiple Choice

Given h(x)=3x2−2x+8 what is h(2)?Given\ h\left(x\right)=3x^2-2x+8\ what\ is\ h\left(2\right)?  

1

13

2

8

3

16

4

answer not here

40

Intercepts
  • X-intercepts are where the graph touches the X-axis

  • Y-intercepts are where the graph touches the Y-axis

media

41

Multiple Choice

Question image

Which interval of the graph is increasing?

1

[-5,5]

2

[0,∞)\left[0,\infty\right)  

3

(−∞,∞)\left(-\infty,\infty\right)  

4

(−∞,0]\left(-\infty,0\right]  

42

Multiple Select

Question image

Which of these are x-intercepts?

1

( 0 , 0 )

2

( 0 , 10 )

3

( 10 , 10 )

4

( 10 , 0 )

5

( 0, 6 )

43

Multiple Choice

Question image
What is f(1)?
1

1

2

5

3

0

4

4

44

Multiple Choice

Question image

How many y-intercepts does this graph have?

1

0

2

1

3

2

4

3

5

Infinite

45

Multiple Choice

Question image

What interval of the function is increasing?

1

[−1,∞)\left[-1,\infty\right)  

2

[−3,∞)\left[-3,\infty\right)  

3

(−∞,−3]\left(-\infty,-3\right]  

4

(−∞,−1]\left(-\infty,-1\right]  

46

Minimums and Maximums
  • Maximum is the highest point on the graph and is written as an ordered pair (6, 4)

  • Minimum is the lowest point on the graph and is written as an ordered pair ( 0, 0 ) and ( 10 , 0 )

media

47

Multiple Choice

Given h(x)=x2−4 what is h(6)?Given\ h\left(x\right)=x^2-4\ what\ is\ h\left(6\right)?  

1

32

2

0

3

-4

4

77

48

Just a little review

...before we move on...

49

media
​Minimum and Maximum

50

Relation or Function?
  • Both have sets of ORDERED PAIRS

  • Both have INPUTS and OUTPUTS

  • Only FUNCTIONS have exactly one output for each input

  • Use the VERTICAL LINE TEST to see if a graph is a function.

51

Multiple Choice

Question image

Find f(2)

1

5

2

4

3

3

4

0

52

Function Notation

53

media

54

Multiple Choice

f(x)=5x−12f\left(x\right)=5x-12 What is f(−4)f\left(-4\right)

1

-32

2

-3

3

-12

4

3

55

Fill in the Blanks

media image

Write the minimum as an ordered pair

Type answer...

56

Multiple Choice

Question image
For what value of x does f(x) = -2?
1

0

2

-5

3

3

4

-3

57

Fill in the Blanks

media image

Type the minimum or maximum as an ordered pair

Type answer...

pattern-tertiary
Evaluate Functions Review
media

Show answer

Auto Play

Slide 1 / 57

SLIDE