
Distance Time Graphs
Presentation
•
Mathematics
•
8th Grade
•
Medium
+6
Standards-aligned

Christy Britton
Used 40+ times
FREE Resource
7 Slides • 22 Questions
1
2
Multiple Choice
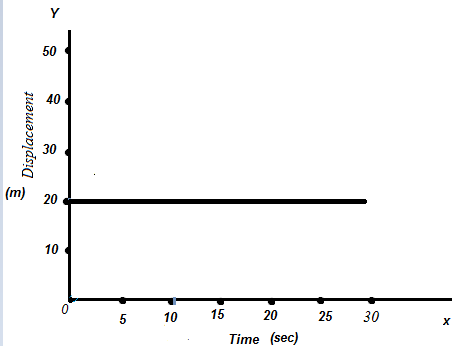
What does this graph mean?
3
Multiple Choice
4
Multiple Choice

5

6

7

8

9
Multiple Choice

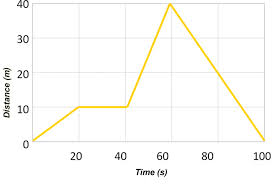
Describe the motion in the graph:
10
Multiple Choice

Describe the motion in the graph:
11
Multiple Choice

Describe the motion in the graph:
12
Multiple Choice

13
Multiple Choice

14
Multiple Choice

15
Multiple Choice

16
Multiple Choice

17
Multiple Choice
18
Multiple Choice

Segment A-B The bus is _________________.
19
Multiple Choice
Segment O-A The bus is _________________.
20
Multiple Choice

Which runner won the race?
21
Multiple Choice
Which runner stopped for a rest?
22
Multiple Choice
How long did Charlie stop for a rest?
23

24
Multiple Choice
25
Multiple Choice

Find the average speed from 30 to 60 minutes on this graph. (Hint: distance traveled during time range /divided by time)
26
Multiple Choice
27
Multiple Choice

What is the speed of segment A?
28
Multiple Choice

What is the total distance traveled?
29

Show answer
Auto Play
Slide 1 / 29
SLIDE
