
Histograms, Dot Plots and Frequency Tables
Presentation
•
Mathematics
•
9th Grade
•
Medium
•
CCSS
2.MD.D.9, 6.SP.B.4, 6.SP.B.5A
+3
Standards-aligned

Darin Brown
Used 52+ times
FREE Resource
2 Slides • 8 Questions
1
2
Multiple Choice

21. How many students are represented by the histogram?
3
Multiple Choice

Which interval has 4 students?
4
Multiple Choice

How many vehicles get no more than 32 miles per gallon?
5
6
Multiple Choice
7
Multiple Choice

How many students had more than 6 candy bars?
8
Multiple Choice

How many students spent over 40 minutes but under 60 minutes studying?
9
Multiple Choice

How many skittles were in one bag?
10
Multiple Choice
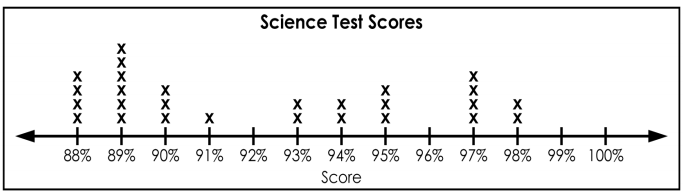
How many total students are in the science class?
Show answer
Auto Play
Slide 1 / 10
SLIDE
