
Stem & Leaf Plot
Presentation
•
Mathematics
•
6th Grade
•
Medium
Standards-aligned

Ks Korner
Used 7+ times
FREE Resource
4 Slides • 30 Questions
1
2

3
4
Open Ended
5
6
Multiple Choice

How many scored 25 or less free throws?
7
Multiple Choice

How many apples were weighed?
8
Multiple Choice

What is the highest ticket price?
9
Multiple Choice

What is the SLOWEST race time?
10
Multiple Choice

How many lunches cost less than $5.90?
11
Multiple Choice

Students recorded how many minutes per hour they used their devices at home.
How many students entered their data on the chart?
12
Multiple Choice

How many students used their device for MORE THAN 20 minutes?
13
Multiple Choice

Teachers recorded the number of fidget spinners they saw students using at school in one day. How many teachers saw a fidget spinner?
14
Multiple Choice

Two teachers saw the same number of fidget spinners.
How many did they see?
15
Multiple Choice

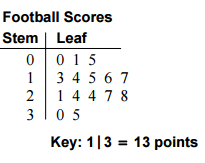
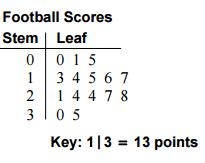
Nick recorded the number of points his basketball team scored during their season in a stem-and-leaf plot. How many games did Nick’s basketball team play?
16
Multiple Choice

During how many games did Nick’s team score BETWEEN 55 and 75 points?
17
Multiple Choice

18
Multiple Choice

19
Multiple Choice
20
Multiple Choice

21
Multiple Choice

How many data items are on the plot?
22
Multiple Choice
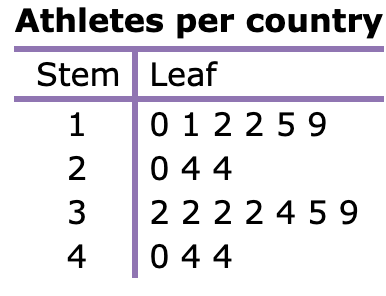
While doing a project for P. E. class, Ling researched the number of athletes competing in an international sporting event.
How many countries have exactly 32 athletes?
23
Multiple Choice

The employee at the department store counted the number of ties on each tie rack.
How many racks have between 30 and 40 ties?
24
Multiple Choice

A Technical Assistance Manager monitored his customers' wait times.
What is the shortest wait time?
25
Multiple Choice

A machine dispensed red gumdrops into bags of various sizes.
How many bags had at least 15 red gumdrops?
26
Multiple Choice

A veterinarian weighed all the dogs that visited his office last month.
How many dogs weighed exactly 22 pounds?
27
Multiple Choice
28
Multiple Choice

Students in the fifth-grade science class used a scale to mass small stones they picked up on the playground. The stem-and-leaf plot shows the masses.
What is the difference between the mass of the heaviest stone and the lightest stone?
29
Multiple Choice

What was the farthest distance?
30
Multiple Choice
How many baseballs were thrown more than 6 feet?
31
Multiple Choice

This stem and leaf plot shows the height of plants in the garden in feet. How many plants were less than 3 feet tall?
32
Multiple Choice
This stem and leaf plot shows the height of plants in the garden in feet. How tall was the shortest plant?
33
Multiple Choice
This stem and leaf plot shows the height of plants in the garden in feet. What is the difference between the tallest plant and the shortest plant?
34
Multiple Choice
This stem and leaf plot shows the height of plants in the garden in feet. What is the total height of all the plants?
Show answer
Auto Play
Slide 1 / 34
SLIDE
