Search Header Logo
  1. Resource Library
  2. Math
  3. Algebra
  4. Linear Relationships
  5. Linear Relationships
Linear Relationships

Linear Relationships

Assessment

Presentation

Mathematics

7th Grade

Easy

Created by

Dorothy Morgano

Used 2+ times

FREE Resource

3 Slides • 12 Questions

1

Linear Relationships

Ms. Morgano

2

Multiple Select

Part A: Who is saving money at a constant rate? Select all

1

Elena

2

Nariyah

3

Sebastian

3

media

4

Dropdown

Question image
​ ​ ​
graph is represented in blue.

5

Open Ended

What is the connection between linear relationships and rate of change?

6

Key Idea!

Linear relationships have a constant rate of change: the ratio of change in y and change in x. The rate of change is also known as slope.

7

Multiple Choice

Question image
Is the table linear or nonlinear?
1

Linear

2

Nonlinear

8

Multiple Choice

Question image

Is the relationship represented by the table linear or nonlinear?

1

linear

2

nonlinear

9

Multiple Choice

Question image

Linear or not linear?

1

Linear

2

Not linear

10

Multiple Choice

Question image

Find the rate of change (slope) for this table.

1

1

2

2

3

11

11

Multiple Choice

Question image
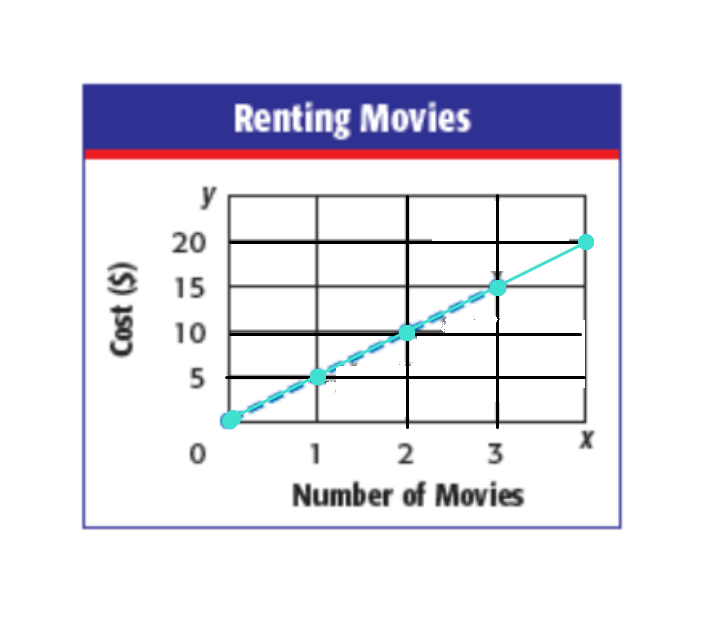
Which rate of change represents the following the graph shown?
1

$ 5 per movie

2

$10 per movie

3

$1 per movie

4

$0.20 per movie

12

Multiple Choice

Question image
Which rate of change represents the following graph?
1

⅓ of a cup each second

2

3 cups each second

3

2 cup each second

4

½ of a cup each second

13

Multiple Choice

Question image

What is the constant rate of change between the quantities in the table?

1

4 calories per minute

2

15 calories per minute

3

40 calories per minute

4

60 calories per minute

14

Multiple Choice

Question image
Which company shows a greater rate of change?
1

Water's Edge Rafts

2

Ryan's Rafts

15

Poll

How well did you understand this lesson?

Linear Relationships

Ms. Morgano

Show answer

Auto Play

Slide 1 / 15

SLIDE