Search Header Logo
1.2 Travel Expenses

1.2 Travel Expenses

Assessment

Presentation

•

Mathematics

•

12th Grade

•

Practice Problem

•

Medium

•
CCSS
HSN.VM.C.6, 6.SP.B.4, HSS.ID.B.6A

+2

Standards-aligned

Created by

William Torres

Used 16+ times

FREE Resource

10 Slides • 6 Questions

1

Multiple Select

Bellwork:

What percent of $40 is $8.20?

1

20.5%

2

20.5

3

$20.5

4

20.50%

2

media

Financial AlgebraSecond Edition

Slide 2

1-2:Travel Expenses: Learning Goals

The students will be able to:

• Determine and interpret cumulative frequency.

• Determine and interpret relative frequency.

• Determine and interpret relative cumulative frequency.

• Determine and interpret percentiles.

3

media

Financial Algebra: Second Edition

Slide 5

Example 1

How many of the trips listed in the Summer Travel table (frequency distribution table) were less than 1000 miles?

4

media

Financial Algebra: Second Edition

Slide 6

Example 1- answer

5

Multiple Choice

Question image

How many trips less than 500 miles in length were taken?

1

584,730,000

2

72,270,000

3

512,460,000

4

32,850,000

6

media

Financial Algebra: Second Edition

Slide 8

Example 2:

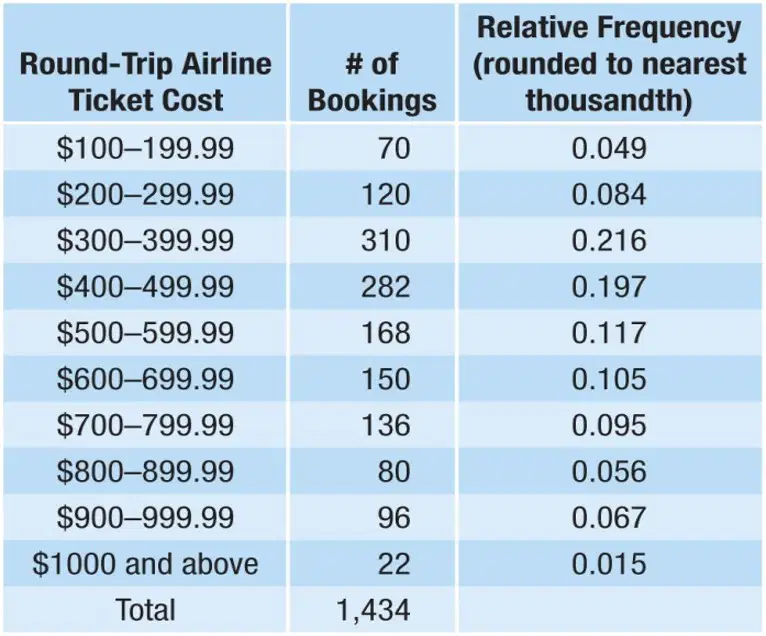
The Flyt Travel website reported the following airfare booking expenses for the week of July 4th.
What proportion of the tickets sold had a cost greater than or
equal to $400 and less than or equal to $499.99?

7

media

Financial Algebra: Second Edition

Slide 9

Example 2: Solution

1

8

Multiple Choice

Question image

What percent of the total number of bookings fall within the range of

$700 - $899.99?

1

15.1%

2

15%

3

9.5%

4

.151%

9

media

Financial Algebra: Second Edition

Slide 8

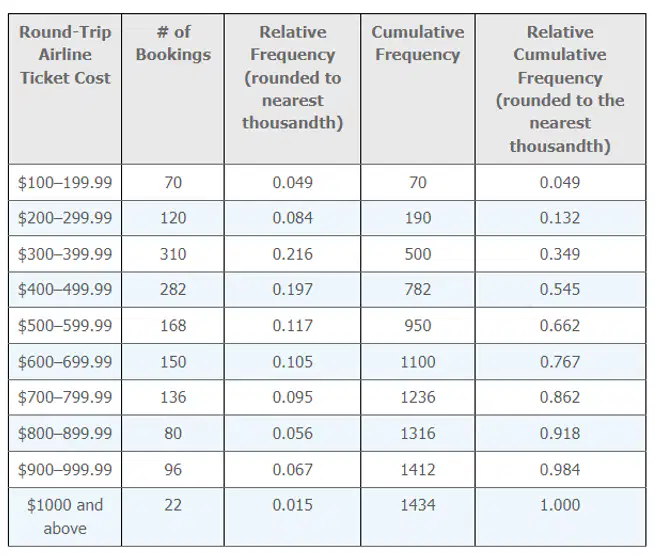
Example 4: Extend the relative frequency table to determine the percent of the Flyt Travel bookings that are below $600.

10

media

Financial Algebra :Second Edition

Slide 9

Example 4 - answer

11

Multiple Choice

Question image

What does 0.545 in the relative cumulative frequency column represent?

1

54.5% of the fares were at or below $499.99

2

54.5% of the fares were at $499.99

3

54.5% of the fares were below $499.99

4

0.545% of the fares were at or below $499.99

12

Multiple Choice

Question image

Rounded to the nearest whole number, what percent of bookings fell between $700 and $999.99?

1

22%

2

.220%

3

.22%

4

2.2%

13

media

Financial Algebra: Second Edition

Slide 12

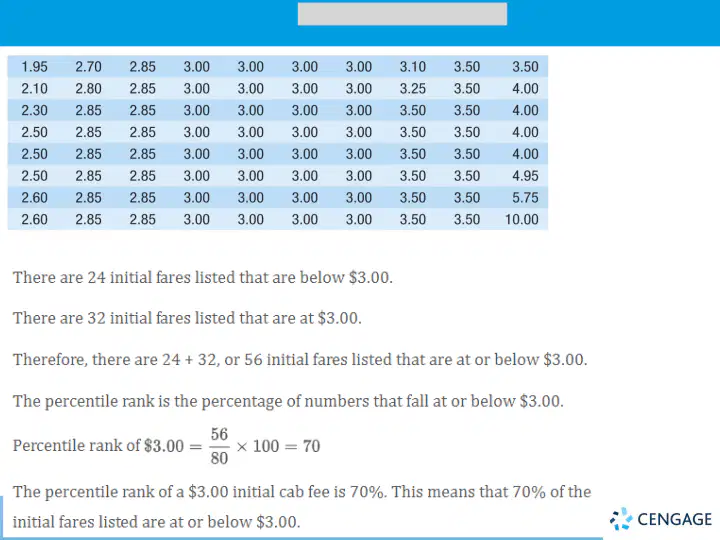
Most cities have some form of taxicab services for short-distance trips. Usually the cab fares are either a flat fee for a specified distance or a metered fee. The metered cabs often start with an initial fee and then charge a fixed rate per fraction of a mile driven. In many cities, wait time and number of stops often affect the fare as well. The website taxifarefinder.com offers a ranking of cities by the cost of a hypothetical taxi trip of a given duration and distance. Of the top 80 most expensive cities, these are the initial cab fees in ranked order:

What is the percentile rank of a $3.00 initial cab fee?

14

media

Financial Algebra: Second Edition

Slide 13

Example 5 - answer

What is the percentile rank of a $3.00 initial cab fee?

15

Multiple Choice

Question image

Determine the percentile rank of an initial fee of $2.85.

1

30%

2

.3%

3

.30%

4

3%

16

media

Financial Algebra: Second Edition

Slide 15

Classwork: Due today

Textbook site:

Left side panel-

Applications 1.2a & b

pattern-tertiary

Bellwork:

What percent of $40 is $8.20?

1

20.5%

2

20.5

3

$20.5

4

20.50%

Show answer

Auto Play

Slide 1 / 16

MULTIPLE SELECT