Search Header Logo
Speed and Velocity

Speed and Velocity

Assessment

Presentation

Science

9th - 12th Grade

Medium

NGSS
MS-ESS1-1, MS-PS3-1, MS-ESS1-2

+4

Standards-aligned

Created by

Lily Price

Used 120+ times

FREE Resource

7 Slides • 6 Questions

1

Multiple Choice

Question image
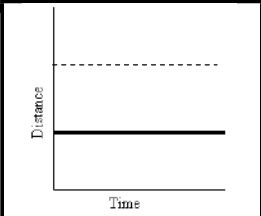
What does this graph represent?
1

Constant Speed

2

Acceleration

3

Not moving

2

Multiple Choice

Question image
What does this graph represent?
1

Constant speed

2

Acceleration

3

Not moving

3

media

Today, I will learn how to calculate speed using the formulat S= D/T.

September 7,2023

4

media

5

media

6

media

7

Multiple Choice

The airplane flew at a speed of 300 miles per hour.
1

Speed

2

Velocity

8

Multiple Choice

A baseball is thrown at 97 mph towards the North of the stadium.

1

Speed

2

Velocity

9

media

Today, I will learn how to calculate speed using the formulat S= D/T.

September 7,2023

10

media

11

media

1) Complete Velocity/Speed WK
2) Complete Speed WK

​​Practice Time!

1) Advocate for your learning! If you need help, you need to ask!
2) Working hard! Get what you need done!
3) Remain in your seat
4) Make sure you are not to loud! You get one warning, then you will work alone and in silence.

Expectations:

12

Multiple Choice

Exit Ticket: Place the answer on a post it note and then place on board based on where you think you are. Put your name on the back!

A car travels 240 m in 2 hours and a sprinter travels 100 m in 9.5 sec. Who is traveling faster?

1

the car

2

the sprinter

3

they are traveling the same speed

4

not enough information to answer this question

13

Multiple Choice

Question image

Which graph shows an object at rest?

1

A

2

B

3

C

4

D

Question image
What does this graph represent?
1

Constant Speed

2

Acceleration

3

Not moving

Show answer

Auto Play

Slide 1 / 13

MULTIPLE CHOICE