Search Header Logo
  1. Resource Library
  2. Math
  3. Data And Graphing
  4. Interpreting Linear Graphs
  5. Describing Distance Graphs With Interval Notation
Describing Distance Graphs with Interval Notation

Describing Distance Graphs with Interval Notation

Assessment

Presentation

Mathematics

10th Grade

Hard

CCSS
HSF.IF.B.4, 8.EE.B.5

Standards-aligned

Created by

Britiany Cox

Used 8+ times

FREE Resource

5 Slides • 7 Questions

1

Learning Targets
I can interpret the graph of a real life linear function.
I can use interval notation to describe the domain and range of a graph of a linear function.

2

​Success Criteria:

  • I can identify the intervals where a function is increasing, decreasing or constant and write the intervals in interval notation.

  • I can interpret each part of the graph in terms of the real­ life phenomena.

  • I can identify the domain and range of the graph that models real life phenomena.

3

media

​Review from Friday

4

Multiple Choice

Question image
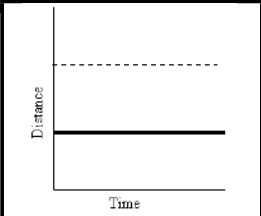
What does this graph represent?
1

Constant speed

2

Acceleration

3

Not moving

5

Multiple Choice

Question image
What is happening at E?
1

The object is not moving

2

Decelerating

3

Slower steady speed; moving away from the starting position

4

Steady speed; returning to start position

6

media

7

Multiple Choice

Question image
  1. What do the intervals of increase mean in the context of the graph?

1

Jimmy's distance from home increased.

2

Jimmy's distance from home decreased.

3

Jimmy arrived at his friend's house.

4

Jimmy arrived at school.

8

media

9

Multiple Choice

Which type of notation is expressed here: (4, 4.7)

1

set notation

2

interval notation

10

Multiple Choice

Question image

What is the range?

1

(0, 40)

2

(70,120)

3

(0,80)

4

(0,120)

11

Fill in the Blank

12

Multiple Choice

Question image

What does the range mean in the context of the graph?

1

It took Jimmy 40 minutes to walk to the bus stop.

2

It took Jimmy 80 minutes to walk to the bus stop.

3

It took Jimmy 70 minutes to walk to the bus stop.

4

It took Jimmy 50 minutes to walk to the bus stop.

Learning Targets
I can interpret the graph of a real life linear function.
I can use interval notation to describe the domain and range of a graph of a linear function.

Show answer

Auto Play

Slide 1 / 12

SLIDE