Search Header Logo
Chapter 11 Recap

Chapter 11 Recap

Assessment

Presentation

•

University

•

Medium

Created by

Lythia Amoakon

Used 2+ times

FREE Resource

13 Slides • 20 Questions

1

Chapter 11 Recap and Practice

This will have a quick recap of chapter 11.
It will also go over the types of questions you may be asked and how to solve them.
Please let me know at the end if it helped improve your understanding of Chapter 11.
There are 2 points EC on Exam 1 for completing the lesson before Wednesday, September 20th.

2

1. ​The Scatterplot

3

Multiple Choice

What is a scatterplot?

1
A type of pie chart
2
A type of bar graph
3

A graphical representation of ordered pairs (X,Y)

4
A type of line graph

4

Explanatory vs Response
  • On the Y-axis of the scatterplot

  • Is explained

  • The variable that we are studying, predicting

Response

  • On the X-axis of the scatterplot

  • Explains

  • The variable that we can control or manipulate

Explanatory

5

Dropdown

Number of hours studying for a test ​


Problems missed on the test​

6

Dropdown

For each of the following pair of variables, determine which one is the explanatory and which is the response variable.

The Outdoor temperature is ​
and Consumption of heating oil is ​


The age of a car is ​
and its resale value is ​


7

Direction, Shape and strength

Scatterplot gives the direction and shape

We are looking for a linear relationship in this class.
If the relationship is not linear, we just mention
non-linear.

media

8

Categorize

Options (4)

The age of a car and the number of miles on its odometer

The number of times a pencil is sharpened and its length

The age of a car and its resale value

The diameter of an apple and its weight

For each of the following pair of variables, determine if the relationship is positive or negative.

Positive
Negative

9

Direction, Shape and strength

The correlation coefficient

  • Gives the direction and strength of a LINEAR relationship.

  • Correlation DOES NOT imply Causation.

  • Correlation IS sensitive to outliers

media

10

Match

Match the following

Is r appropriate?

Why?

Yes,

Weak Linear Relationship

No,

We have Outliers

No,

Non-linear Relationship

Yes,

Linear Relationship

11

Reorder

Reorder the STEPS to find the correlation coefficient using the TI-84

(Some a broken down in 2)

2nd --> 0 --> X-1--> DiagnosticsOn --> Enter

(Diagnostics Turned On)

STAT --> 1:Edit -->

L1: X, L2:Y

(Adding the lists)

STAT --> CALC --> 8 -->

Xlist:L1, Ylist:L2 -->Calculate

1
2
3
4
5

12

The Regression Line Equation

a + bx

  • b is the slope and can be interpreted as follow :

    • If b is positive :
      For every increase in the explanatory (x) variable, the response variable increases by b.

    • If b is negative :
      For every increase in the explanatory (x) variable, the response variable decreases by b.

13

About Residuals

I know we talked about residuals today in class; after looking at the book for more examples, It seems like this is not something that we cover in this class anymore.
We only cover Sections 1 and 2 now.
I apologize for the mix-up. I will make sure to fix it for the next class :)

14

Multiple Choice

Question image

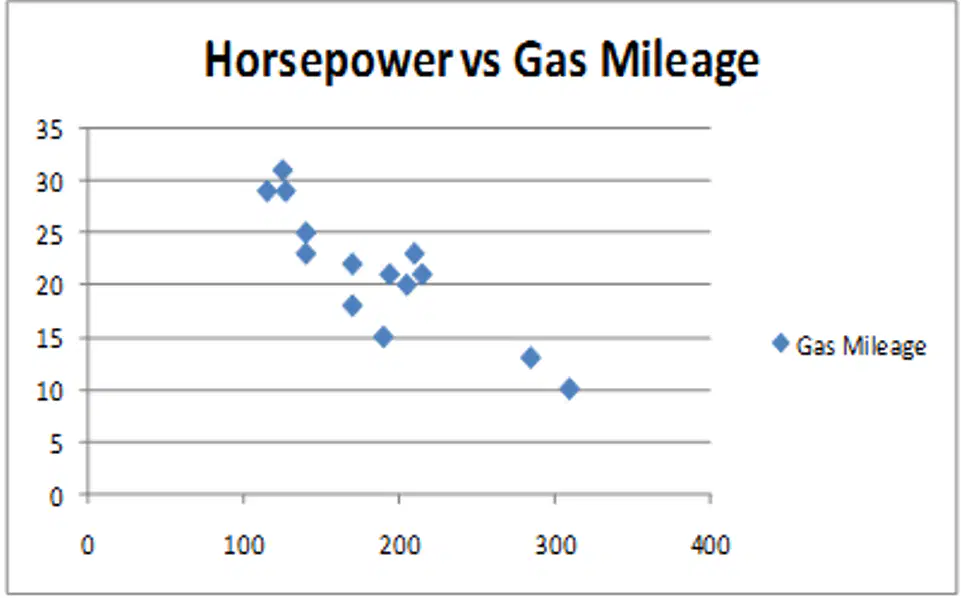
Here are the advertised horsepower ratings (hp) and expected gas mileage (mpg) for several 2001 vehicles.

Describe the scatterplot.

1

Negative Linear

2

Positive Linear

3

Negative Non-Linear

4

Positive Non-Linear

15

The relationship is negative linear

Negative: Our plot goes from the upper left to the lower right.

Linear: We can draw a line where most of the points will be packed around.

16

Fill in the Blanks

media image

Here are the advertised horsepower ratings (hp) and expected gas mileage (mpg) for several 2001 vehicles.

Give the regression equation

17

Finding the regression equation with TI-84

  1. Turn your diagnostics on

  2. Add your lists : L1 : Horsepower and L2: Gas Mileage

  3. STAT --> CALC --> 8 --> Xlist : L1, Ylist: L2

  4. Substitute a and b with the values from the calculator

    Remember the general for the equation is a+bx

18

Fill in the Blanks

media image

Here are the advertised horsepower ratings (hp) and expected gas mileage (mpg) for several 2001 vehicles.

Give the correlation coefficient

19

Finding the correlation coefficient with TI-84

The Correlation coefficient, r, is the last result on your calculator using the same steps as before.
Turning the diagnostic on enables you to see r

and here, r= -0.88

20

Fill in the Blanks

media image

Here are the advertised horsepower ratings (hp) and expected gas mileage (mpg) for several 2001 vehicles.

Give the slope

21

Dropdown

Question image
Here are the advertised horsepower ratings (hp) and expected gas mileage (mpg) for several 2001 vehicles.

Interpret the slope

For every 1 ​
, the ​
​
by 0.092 ​
.

22

Finding the slope with TI-84

The slope is b on your calculator and in your equation.
b = -0.092
For every 1 ​ hp , the ​ gas mileage ​ decreases by 0.092 ​ mpg .

23

media
More questions

24

Multiple Choice

What is not true about the correlation coefficient?

1
It measures the strength and direction of the linear relationship between two variables
2
It ranges from -1 to 1
3
It is not affected by changes in the scale of measurement
4

It can be used to infer causality

5

It is not resistant

25

Multiple Choice

The correlation coefficient between the price of eggs and the price of milk is 0.845.

In a month where the price of eggs is above average, would you expect the price of milk to be above average or below average? Explain.

1

Above average, because the positive correlation indicates that as one variable increases, the other also increases.

2

Below average, because the positive correlation indicates that as one variable increases, the other decreases.

3

Above average, because the negative correlation indicates that as one variable decreases, the other also decreases.

4

Below average, because the negative correlation indicates that as one variable decreases, the other increases.

26

Multiple Choice

The correlation coefficient between the price of eggs and the price of milk is 0.845.

Which of the following is the best interpretation of the correlation coefficient?

1

When the price of eggs rises, it causes the price of milk to rise.

2

When the price of milk rises, it causes the price of eggs to rise.

3

When the price of milk rises, it causes the price of eggs to drops.

4

Changes in the price of eggs or milk do not cause changes in the price of the other; the correlation indicates that the prices of milk and eggs tend to go up and down together.

27

Multiple Choice

The correlation coefficient between the height and weight of the quarterbacks is 0.674.

Which of the following is the best interpretation of the correlation coefficient?

1

If a quarterback gains weight, he will grow taller.

2

Given two quarterbacks, the taller one is likely to be heavier than the shorter one.

3

Given two quarterbacks, the heavier one is likely to be shorter than the lighter one.

28

Dropdown

When we are given the value of the ​
variable, we can use the least-squares regression line to predict the value of the ​
variable.

29

Multiple Choice

Question image

To the left is the least-squares regression line for predicting the price of milk from the price of eggs.

If the price of eggs differs by $0.25 from one month to the next, how much would you expect the price of milk to differ?

1

0.10

2

0.25

3

-0.25

4

-0.10

30

Finding the predicted difference

Δ means difference.
Let's answer the question we got and do more practice.
Our regression equation is : 2.7592 + 0.3991x
We are looking for the predicted difference in price of milk given the difference in price of eggs from one month to another.
Δx = $0.25
b = 0.3991
Hence, Δy = 0.3991 * $0.25 = $0.10

​Δy= bΔx

​The math behind this equation
y1=a+bx1
y2= a+bx2
Δy=y2-y1=a+bx2- (a+bx1)
Δy=a-a+bx2-bx1
Δy = b(x2-x1)
​Δy= bΔx

31

Multiple Choice

Question image

To the left is the least-squares regression line for predicting the price of milk from the price of eggs.

If the price of eggs differs by $0.5 from one month to the next, how much would you expect the price of milk to differ?

1

0.20

2

0.5

3

-0.25

4

-0.12

32

Multiple Choice

Question image

To the left is the least-squares regression line for predicting weight from height.

If two quarterbacks differ in height by 2 inches, how much would you predict their weights to differ?

1

9.2

2

4.6

3

2

4

-2

33

Open Ended

Would you prefer the recap for chapters to be like this?

Did this help you with Chapter 11?

pattern-tertiary
Chapter 11 Recap and Practice

This will have a quick recap of chapter 11.
It will also go over the types of questions you may be asked and how to solve them.
Please let me know at the end if it helped improve your understanding of Chapter 11.
There are 2 points EC on Exam 1 for completing the lesson before Wednesday, September 20th.

Show answer

Auto Play

Slide 1 / 33

SLIDE