Search Header Logo
  1. Resource Library
  2. Math
  3. Data And Graphing
  4. ...
  5. Learning About Bar Graphs
Learning about Bar Graphs

Learning about Bar Graphs

Assessment

Presentation

Mathematics

2nd Grade

Easy

CCSS
1.MD.C.4, 2.MD.D.9, 2.MD.D.10

+13

Standards-aligned

Used 32+ times

FREE Resource

8 Slides • 35 Questions

1

What is a bar graph?

A bar graph uses bars to show information or data

media

2

Bar Graphs

media

3

​What are bar graphs?

  • a way to display data using rectangles or bars of different sizes

media

4

Bar Graph

  • How many oranges were there?

  • How many Kiwis were there?

media

5

media
  • First ,look at the title to see what we are discussing.

  • Next ,find the item you want info on.

  • Look at the bar and slide your finger to see what number it stops on.

How to read a bar graph?!?

6

media

7

Bar graphs

Answer the following questions according to the bar graph

media

8

Multiple Choice

Question image

How many students like vanilla and chocolate?

1

8

2

32

3

30

4

28

9

Multiple Choice

Question image

Which sport did kids like most?

1

Soccer

2

Softball

3

Basketball

4

Other

10

Multiple Choice

Question image

Which sport did kids like least?

1

Soccer

2

Softball

3

Basketball

4

Other

11

Look at the chart. Choose the correct bar graph. Think - don't answer yet!

media

12

Multiple Choice

Question image

Were there more banana pieces or orange pieces?

1

banana pieces

2

Orange pieces

13

Multiple Choice

Question image

Which flavor had exactly 5 pieces in the bag?

1

Banana

2

Strawberry

3

Orange

4

Watermelon

14

Multiple Choice

Question image

Which drink did 7 people pick as their favorite?

1

Juice

2

Milk

3

Water

15

Multiple Choice

Question image

Which bar graph represents the data from the chart?

1
2

16

Multiple Choice

Question image
What type of graph is this?
1
Bar Graph
2
Line Plot
3
Pictograph
4
Tally Chart

17

Multiple Choice

Question image

Which day had the most books read?

1

Thursday

2

Friday

3

Saturday

4

Sunday

18

Multiple Choice

Do pictographs or bar graphs have titles?
1
pictographs
2
bar graphs
3
both

19

Multiple Choice

Question image

Which day had the least books read?

1

Thursday

2

Friday

3

Saturday

4

Sunday

20

Multiple Choice

Question image

What type of graph is this?

1

Circle Graph

2

Pictograph

3

Line Graph

4

Bar Graph

21

Multiple Choice

Question image

How many books were read on Saturday and Sunday?

1

4

2

6

3

10

22

Multiple Choice

Question image

Which pizza topping was chosen by exactly 20 people?

1

Cheese

2

Mushroom

3

Sausage

4

Pepperoni

23

Multiple Choice

Question image

Which lunch do most students like?

1

Hamburger

2

Pizza

3

Taco

24

Multiple Choice

Question image
How many total votes were collected?
1
5
2
10
3
15
4
20

25

Multiple Choice

Question image

How many students voted in TOTAL?

1

7

2

5

3

16

26

Multiple Choice

Question image

How many votes did reading and social studies receive together?

1

9

2

11

3

13

4

15

27

Multiple Choice

Question image

How many people like soccer or tennis?

1

10

2

7

3

3

28

Multiple Choice

Question image

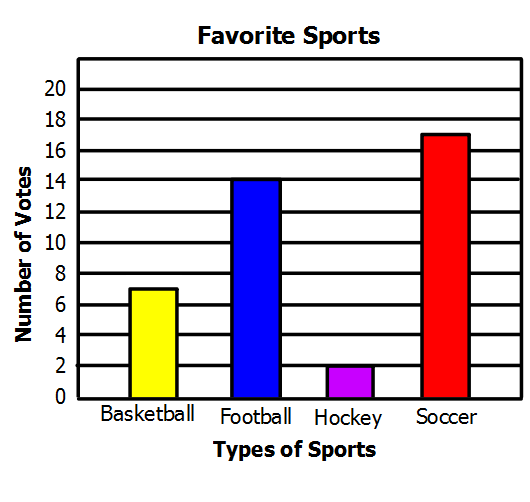
How many people chose football as their favorite sport?

1

2

2

15

3

14

4

17

29

Multiple Choice

Question image

How many votes are there in total?

1

12

2

20

3

7

30

Multiple Choice

Question image

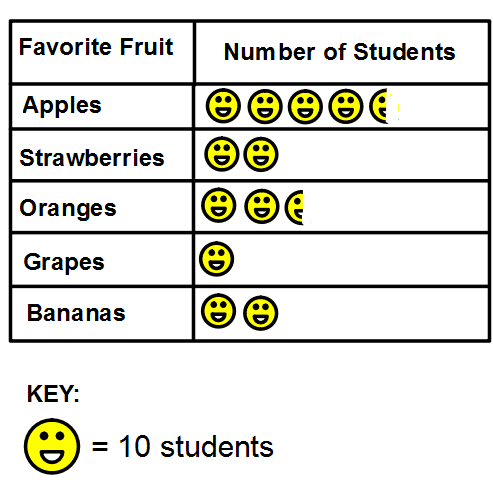
How many students like strawberries the best?

1

2

2

40

3

20

4

10

31

Multiple Choice

Question image

How many students like apples as their favorite fruit?

1

1

2

2

3

3

32

Multiple Choice

Question image

See the pictograph to answer the question.

How many guava trees are there in the farm?

1

10

2

40

3

60

4

50

33

Multiple Choice

Question image

TRUE or FALSE: There are more votes for apples than oranges

1

True

2

False

34

Multiple Choice

Question image

How many students take the bus to school?

1

35

2

20

3

10

4

15

35

Multiple Choice

Question image

How many books were read in June?

1

1

2

2

3

4

36

Multiple Choice

Question image

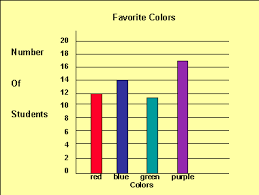
How many more people like red than purple?

1

8

2

13

3

2

4

5

37

Multiple Choice

Question image

How many books were read in July?

1

2

2

3

3

4

38

Multiple Choice

Question image

How many fewer people chose grapes as their favorite fruit than pears?

1

9

2

5

3

4

4

1

39

Multiple Choice

Question image

How many books were read in May?

1

2

2

3

3

4

40

Multiple Choice

Question image

How many books were read ALL TOGETHER?

1

7

2

9

3

11

41

Multiple Choice

Question image

How many student's like carrots or broccoli as their favorite vegetable?

1

5

2

6

3

7

42

Multiple Choice

Question image

How many votes were there all together?

1

7

2

11

3

15

43

Poll

Vote on your favorite food

Pizza

Mac N Cheese

Cheeseburger

Hot dog

What is a bar graph?

A bar graph uses bars to show information or data

media

Show answer

Auto Play

Slide 1 / 43

SLIDE