Search Header Logo
6th- Types and Reading graphs Day 3

6th- Types and Reading graphs Day 3

Assessment

Presentation

Science

6th Grade

Medium

NGSS
MS-LS2-1, MS-PS3-1, MS-PS1-1

+5

Standards-aligned

Created by

Tyanna Bailey

Used 4+ times

FREE Resource

0 Slides • 54 Questions

1

Multiple Choice

Question image

What does this graph show?

1

Dogs on a leash

2

Students

3

Popcorn sold

4

Teachers

2

Multiple Choice

Question image

On a small island, scientists kept track of the number of wolves and moose over time. Which trend did they record?

1

A drop in wolf population and a drop in moose population

2

An increase in wolf population and a drop in moose population

3

A drop in wolf population and an increase in moose population

4

An increase in wolf population and an increase in moose population

3

Multiple Choice

Question image

Look at the bar graph. Can you tell what the bar graph measures?

1

Kilowatts used by appliances per day

2

Average Hours appliances were used per day

3

Number of hours each appliance was used per day

4

Hours appliance used monthly

4

Multiple Choice

Question image

What day was the MOST popcorn sold?

1

Monday

2

Tuesday

3

Wednesday

4

Thursday

5

Multiple Choice

Question image
Which appliance is used twice as many hours on the weekends as it is on weekdays?
1
Lights
2
Computer
3
Refrigerator
4
Television

6

Multiple Choice

Question image

According to this chart, which country spent the least money on books in 2004?

1

Germany

2

France

3

Italy

4

Australia

7

Multiple Choice

Question image

The bar graph shows data about the pets owned by math students in four classes. One bar is missing from the graph. If the students have a total of 32 dogs, which bar shows the number of dogs Ms. Davalos's class has?

1
2
3
4

8

Multiple Choice

Question image

What day was the LEAST popcorn sold?

1

Monday

2

Tuesday

3

Wednesday

4

Thursday

9

Multiple Choice

Question image

Which month had the greatest number of books read?

1

November

2

December

3

January

4

February

10

Multiple Choice

Question image

This chart shows the composition of lunar soil. Which element is third most abundant?

1

Silicon

2

Magensium

3

Iron

4

Impossible to tell

11

Multiple Choice

Question image

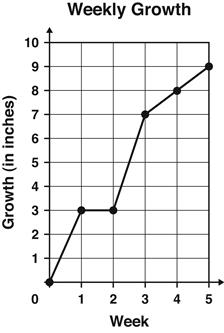
The graph shows the number of inches a plant grew each week.

Between which 2 weeks did the plant grow the MOST?

1

Week 1 and Week 2

2

Week 2 and Week 3

3

Week 3 and Week 4

4

Week 4 and Week 5

12

Multiple Choice

Question image

How many bags of popcorn were sold on Sunday?

1

2

2

3

3

4

4

5

13

Multiple Choice

Question image
How many more miles did Jason drive on Wednesday than on Tuesday?
1
40 miles
2
10 miles
3
5 miles
4
50 miles

14

Multiple Choice

Question image

According to this chart, which plant seems to grow best in full or partial sun?

1

Geranium

2

Impatiens

3

Fuchsia

4

Trillium

15

Multiple Choice

Question image

What does this graph show?

WHAT IS THE TITLE OF THE GRAPH?????

1

Number of basketballs

2

Number of Slam Dunks

3

Number of teams

4

Number of people

16

Multiple Choice

Question image

According to this chart, in which condition does fuchsia grow best in?

CLICK THE PICTURE TO MAKE IT BIGGER!!

1

Full sun

2

Partial sun

3

Partial shade

4

Dappled sun

5

Full shade

17

Multiple Choice

The Y axis is _______?
1
Vertical
2
Horizontal
3
criss-cross
4
diagonal

18

Multiple Choice

Question image

What team scored the MOST slam dunks?

1

Rockets

2

Celtics

3

Bulls

4

Pistons

19

Multiple Choice

The X axis is _______?
1
vertical
2
diagonal
3
criss-cross
4
horizontal

20

Multiple Choice

Question image

According to this chart, which appliance is used 8 hours per day on weekdays?

1

TV

2

Computer

3

Fridge

4

Heater

21

Multiple Choice

Question image

How many slam dunks did the Celtics score?

1

1

2

2

3

3

4

4

22

Multiple Choice

Question image

According to this chart, what appliance is used second most on weekends?

1

Lights

2

TV

3

Heater

4

Other

23

Multiple Choice

Question image

How many slam dunks did the Bulls score?

1

2

2

4

3

6

4

8

24

Multiple Choice

Question image

Which ice cream is least liked by both grades?

1

Vanilla

2

Strawberry

3

Lemon

4

Chocolate

5

Peach

25

Multiple Choice

Question image

What day had the MOST rain?

CLICK THE GRAPH TO MAKE IT BIGGER!!

1

Monday

2

Tuesday

3

Wednesday

4

Thursday

26

Multiple Choice

Question image

Which ice cream is most liked by second grade?

1

Vanilla

2

Strawberry

3

Lemon

4

Chocolate

5

Peach

27

Multiple Choice

Question image

What does this graph show?

1

Tears students cried

2

Rain

3

Water in a river

4

Sunshine

28

Multiple Choice

Question image

Which ice cream is second most liked by first grade?

1

Vanilla

2

Strawberry

3

Lemon

4

Chocolate

5

Peach

29

Multiple Choice

Question image

How many millimeters of rain did it rain on Sunday?

1

2

2

4

3

6

4

8

30

Multiple Choice

Question image

What is the approximate average height of the Douglas Fir trees sampled in this chart?

1

100 feet

2

150 feet

3

200 feet

4

225 feet

5

250 feet

31

Multiple Choice

Question image

How many millimeters of rain did it rain on Monday?

1

2

2

4

3

6

4

5

32

Multiple Choice

Question image

Which tree has an average height of about 75 feet?

1

Lodgepole Pine

2

Western Red Cedar

3

Sitka Spruce

4

Douglas Fir

5

Impossible to tell

33

Multiple Choice

Question image

Who drew the MOST pictures?

1

Cody

2

Robin

3

Rachel

4

Emily

34

Multiple Choice

Question image

Which type of milk is the favorite of respondents to this survey?

1

Plain skim milk

2

Plain 1% milk

3

Plain 2% milk

4

Plain whole milk

35

Multiple Choice

Question image

How many pictures did Robin draw?

1

2

2

4

3

6

4

8

36

Multiple Choice

Question image

What percentage of respondents say that plain whole milk is their favorite?

1

5.2

2

9

3

14

4

27

37

Multiple Choice

Question image

How many pictures did Rachel draw?

1

1

2

2

3

3

4

4

38

Multiple Choice

Question image

Which city has the lowest average temperature in March?

1

Tokyo

2

New York

3

Berlin

4

London

39

Multiple Choice

Question image

How many pictures did Cody draw?

1

10

2

2

3

8

4

4

40

Multiple Choice

Question image

Which city has the highest average temperature in August?

1

Tokyo

2

New York

3

Berlin

4

London

41

Multiple Choice

Question image

What does this graph show?

1

Ice Cream sold

2

Days of the week

3

Cats on cars

4

Ice Cream melted

42

Multiple Select

Question image

Which two cities have the closest average temperatures in June?

1

Tokyo

2

New York

3

Berlin

4

London

43

Multiple Choice

Question image

What flavor sold the MOST ice cream?

1

Cherry

2

Bubble Gum

3

Orange

4

Cotton Candy

44

Multiple Choice

Question image

Which day of the week has the most traffic accidents for New York City?

1

Tuesday

2

Thursday

3

Saturday

4

Sunday

45

Multiple Choice

Question image

What flavor sold the LEAST ice cream?

1

Cherry

2

Orange

3

Cotton Candy

4

Chocolate

46

Multiple Choice

Question image

Which day of the week has roughly 125 accidents on average?

1

Tuesday

2

Wednesday

3

Thursday

4

Friday

47

Multiple Choice

Question image

How many cones did orange sell?

1

2

2

4

3

6

4

8

48

Multiple Select

Question image

Which days of the week have fewer than 150 accidents on average?

1

Monday

2

Tuesday

3

Wednesday

4

Thursday

5

Friday

49

Multiple Choice

Question image

What type of graph is this?

1
Line Graph
2
Pictograph
3
Bar Graph
4
Histogram

50

Multiple Choice

Question image
What type of graph is this?
1
Line Graph
2
Pictograph
3
Bar Graph
4
Histogram

51

Multiple Choice

Question image
Which type of graph is this?
1
Histogram
2
Bar Graph
3
Stem Plot
4
Box Plot

52

Multiple Choice

Question image
What type of graph is this?
1
Bar graph
2
Histogram
3
Pie Chart
4
Stem Chart

53

Multiple Choice

The __ - axis is vertical in the coordinate plane.
1
X
2
Y
3
Z
4
None of the above

54

Multiple Choice

The __ - axis is the horizontal axis of the coordinate plane.  
1
X
2
Y
3
Z
4
None of the above
Question image

What does this graph show?

1

Dogs on a leash

2

Students

3

Popcorn sold

4

Teachers

Show answer

Auto Play

Slide 1 / 54

MULTIPLE CHOICE