Search Header Logo
  1. Resource Library
  2. Math
  3. Algebra
  4. Graphing Equations
  5. Graphing Equations
Graphing Equations

Graphing Equations

Assessment

Presentation

Mathematics

6th - 8th Grade

Practice Problem

Easy

Created by

Mark Collins

Used 2+ times

FREE Resource

9 Slides • 15 Questions

1

GRAPHING EQUATIONS

We Have Already...
Turned word problems into equations by looking for "each" and "per".


Turned equations into data tables by plugging in a number for X and solving for Y


Plotted points on a graph by looking at the X and Y axis.


Seeing straight lines on a graph slanted up (Positive) & slanted down (Negative).


2


Today We Are...

Putting all of this together

Connecting dots on a graph to make a line.

3

Look at the Y-axis line going up and down.

The Second Number is Y

Look at the X-axis line going left & right.

First Number is X

Do you remember how to plot points on a graph?

4

Multiple Choice

Question image
What are the coordinates for the school?
1
(5,2)
2
(1,4)
3
(1,2)
4
(4,1)

5

Multiple Choice

Question image
What is located at (5,3)?
1
nothing
2
point A
3
the park
4
point B

6

Multiple Choice

Question image

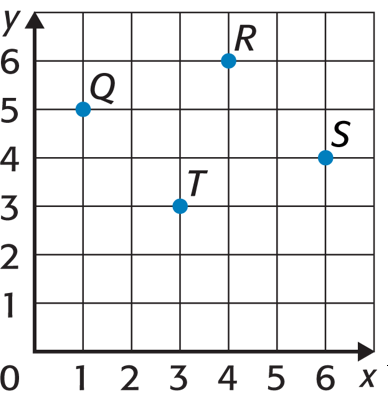
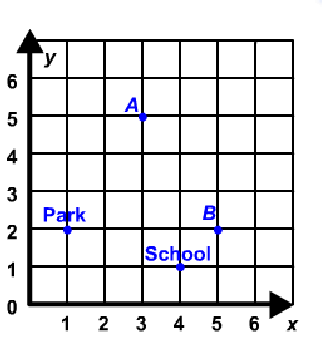
Name the point for the ordered pair (4,6).

1
Q
2
R
3
S
4
T

7

Do You Remember
How To Turn Word Problems Into Equations?

8

Multiple Choice

Bob has $150 in his savings account and saves $40 per month.

1

150 + 40 = Y

2

40x + 150 = Y

3

150x + 40 = Y

9

Do you remember how to complete a data table?

10

Multiple Choice

Question image

What value is missing from the table?

1

12

2

18

3

50

4

55

11

Can We Figure Out How to......

Use the X & Y numbers on a data table to plot points on a graph?

12

Multiple Choice

Question image

Which graph represents the data in the table?

1
2

13

Multiple Choice

Question image

Which table represents the data in the graph?

1
2

14

Dropdown

A linear function creates a ​
when represented on a graph.​

15

Match

When linear functions are graphed they have a certain type of slope.

Match the graph with the correct type of slope.

Positive Slope

Negative Slope

Zero Slope

Undefined Slope

16

Can We Remember That...

Dots in a straight line beginning at 0,0
make a proportional relationship.

17

Multiple Choice

Question image

Do the matching table and graph represent a proportional relationship?

1

Yes, they represent a proportional relationship.

2

No, they do not represent a proportional relationship.

18

Multiple Choice

Question image

Do the matching table and graph represent a proportional relationship?

1

Yes

2

No

19

The point (40,50) tells us that 40 seconds after Tyler started walking, he was 50 meters from the ticket booth.

  • .

media

20

Fill in the Blank

Type answer...

21

Fill in the Blank

Type answer...

22

The graph shows the amounts of almonds, in grams, for different amounts of oats, in cups, in a granola mix.

  • You will need to identify the value of k in the point (1,k) .

  • Then interpret the meaning of it the coordinate point.

media

23

Multiple Choice

Question image

Part 1: Identify the value of k in the point (1,k) .

1

1

2

20

3

25

4

30

24

Fill in the Blank

Type answer...

GRAPHING EQUATIONS

We Have Already...
Turned word problems into equations by looking for "each" and "per".


Turned equations into data tables by plugging in a number for X and solving for Y


Plotted points on a graph by looking at the X and Y axis.


Seeing straight lines on a graph slanted up (Positive) & slanted down (Negative).


Show answer

Auto Play

Slide 1 / 24

SLIDE