
Linear Representation Lesson
Presentation
•
Mathematics
•
7th Grade
•
Practice Problem
•
Medium
Standards-aligned

Elizabeth Loera
Used 17+ times
FREE Resource
6 Slides • 14 Questions
1
Linear Representations

Using a Constant Rate of Change to write a linear equation from table, graph, and/or scenarios.
2
How to write an equation using a graph.
Step 1: Find the y-intercept, and record that in the blank.
Step 2: Find the constant rate of change and record that in the box.
Step 3: Rewrite in the y=mx+b format.

3
Draw
Find the Constant Rate of Change in this graph.
Step 1: Find the y-intercept, and record that in the blank.
Step 2: Find the constant rate of change and record that in the box.
Step 3: Rewrite in the y=mx+b format.
4
Draw
Find the Constant Rate of Change in this graph.
Step 1: Find the y-intercept, and record that in the blank.
Step 2: Find the constant rate of change and record that in the box.
Step 3: Rewrite in the y=mx+b format.
5
Draw
Find the Constant Rate of Change in this graph.
Step 1: Find the y-intercept, and record that in the blank.
Step 2: Find the constant rate of change and record that in the box.
Step 3: Rewrite in the y=mx+b format.
6
Match
Match the following graph with the equations.
y = 10x
y = 18x
y = 5x + 60
y = 12x + 20
y = 10x
y = 18x
y = 5x + 60
y = 12x + 20
7
Multiple Choice
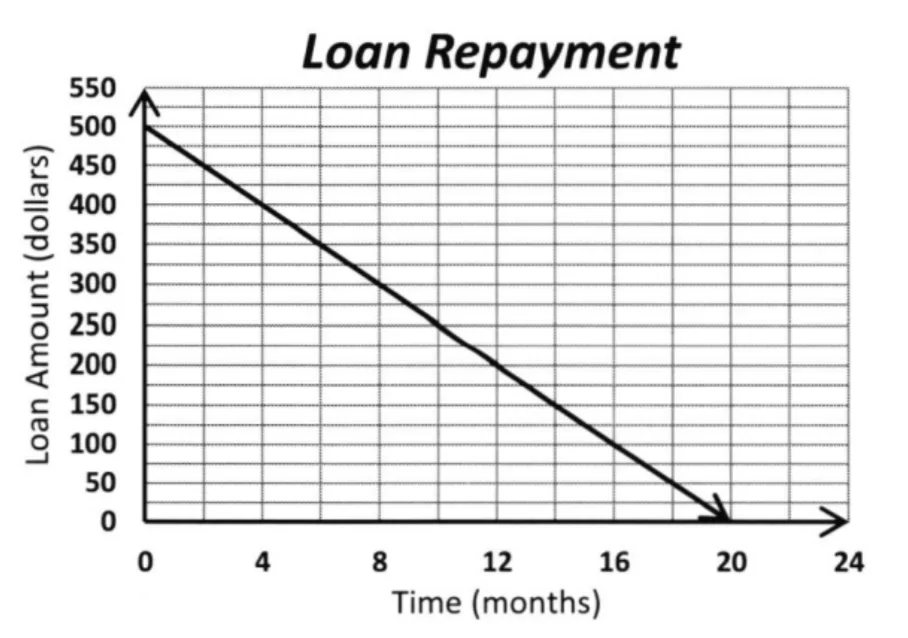
What is the equation that represents the relationship between the number of months to remaining balance on the loan?
y = 50 x + 500
y = 500x + 50
y = -500x + 50
y = -50x + 500
8
How to write an equation using a scenario and graph.
Step 1: Use the graphic organizer: x + _____
Step 2: Find the constant rate of change and record that in the box. That is what you are going to skip by on the graph.
Step 3: Find the y-intercept, the number that is given, the add-on, the adjustment, or what you start with. write that in the blank.
Step 4: Rewrite in the y=mx+b format.
9
Draw
Esteban went bowling with his friends. The cost to bowl is $5 per game with a rental shoe fee of $3.
10
Hotspot
Graph the first 3 coordinates for the following scenario: The Texas State Rodeo charges $12.50 to enter the grounds and an additional $2.50 per ride in the carnival.
11
Hotspot
Graph the first 3 points of the following scenario: The entrance ticket for the Holiday fair is $8 and each ride is $2.
12
Hotspot
Ms. Ibrahim traveled a total of 150 miles for work in 5 days. She traveled the same distance for work each day.
Which three points lie on the line that represents the total distance in miles, y, she traveled for work in x days?
click on THREE correct points.
13
Math Response
Look at the graph, and write the equation that matches this graph.
14

Step 1: determine where the line crossed the y-axis, and place that in the blank.
Step 2: determine the CROC of the line, and place that in the box.
Step 3: rewrite the equation in the y=mx+b format.
x + _____
How to write the equation with a 4-quadrant graph.
15
Step 1: determine where the line crossed the y-axis, and place that in the blank.
Step 2: determine the CROC of the line, and place that in the box.
Step 3: rewrite the equation in the y=mx+b format.
x + _____
How to write the equation with a 4-quadrant graph.

16
How to graph the equation on a 4-quadrant graph.

17
Graphing
Graph the equation
y = 2x + 2
18
Graphing
Graph the equation,
y = -5x + 10
19
Graphing
Graph the equation,
y = 53 x - 3
20
Graphing
Graph the equation,
y=−21x+7
Linear Representations
Using a Constant Rate of Change to write a linear equation from table, graph, and/or scenarios.
Show answer
Auto Play
Slide 1 / 20
SLIDE
Similar Resources on Wayground

13 questions
Lesson 2: Adding and Subtracting Rational Numbers
Presentation
•
7th Grade
13 questions
Volume of Rectangular Prisms
Presentation
•
7th Grade
17 questions
Subtracting Integers
Presentation
•
7th Grade
15 questions
Adding Integers
Presentation
•
7th Grade
15 questions
Making Predictions about a Population
Presentation
•
7th Grade
16 questions
Volume of Square Pyramids
Presentation
•
7th Grade
16 questions
Notes - Combining Like Terms
Presentation
•
7th Grade
14 questions
Proportional Relationships
Presentation
•
7th Grade
Popular Resources on Wayground
28 questions
US History Regents Review
Quiz
•
11th Grade
36 questions
Biology Regents Review
Quiz
•
9th - 10th Grade
20 questions
Math Review
Quiz
•
3rd Grade
38 questions
Regents Life Science General Review
Quiz
•
9th Grade
20 questions
Math Review
Quiz
•
6th Grade
21 questions
EOY Grade 6 Benchmark Assessment - Content Skills
Quiz
•
6th Grade
20 questions
Inferences
Quiz
•
4th Grade
20 questions
Figurative Language Review
Quiz
•
6th Grade
Discover more resources for Mathematics
44 questions
7th Math Review
Quiz
•
7th Grade
18 questions
Subtracting Integers
Quiz
•
7th Grade
15 questions
25-26 7th Grade Math EOY Assessment
Quiz
•
7th Grade
22 questions
distributive property
Quiz
•
7th Grade
11 questions
Decimal/fraction conversions quick check
Quiz
•
5th - 7th Grade
14 questions
order of operations
Quiz
•
7th Grade
20 questions
7th Grade Math Review
Quiz
•
7th Grade
20 questions
Adding Integers (NO CALCULATOR!)
Quiz
•
6th - 7th Grade