
untitled
Presentation
•
•
Practice Problem
•
Hard

Leslie Joy Sidon
FREE Resource
5 Slides • 128 Questions
1
Multiple Choice

What are observations that are measured or counted called?
2
Multiple Choice
What are observations that are measured or counted called?
3
Multiple Choice

What are observations made using our five senses called?
4
Multiple Choice

I use rulers, scales and calculators to make these observations.
5
Multiple Choice

The flower is 8 cm tall.
6
Multiple Choice

The center of the flower is yellow and fuzzy.
7
Multiple Choice

The flower has 25 petals.
8
Multiple Choice

The rose has three leaves.
9
Multiple Choice

The bearded iris smells sweet.
10
Multiple Choice
11
Multiple Choice

12
Multiple Choice
13
Multiple Choice
14
Multiple Choice
15
Multiple Choice
What are observations that are measured or counted called?
16
Multiple Choice
What are observations made using our five senses called?
17
Multiple Choice
I use rulers, scales and calculators to make these observations.
18
Multiple Choice
The flower is 8 cm tall.
19
Multiple Choice
The center of the flower is yellow and fuzzy.
20
Multiple Choice
The flower has 25 petals.
21
Multiple Choice
The rose has three leaves.
22
Multiple Choice
The bearded iris smells sweet.
23
Multiple Choice
24
Multiple Choice
25
Multiple Choice
26
Multiple Choice
27
Multiple Choice
28
29
30
Multiple Choice
31
Fill in the Blanks
32
Multiple Choice
33
Multiple Choice
34
Fill in the Blanks
35
Multiple Choice
36
Fill in the Blanks
37
Multiple Choice
38
Fill in the Blanks
39
Multiple Choice
40
Multiple Choice
41
Multiple Choice
42
Multiple Choice
43

44
45
46
Multiple Choice
47
Multiple Choice
48
Multiple Choice
49
Multiple Choice
50
Multiple Choice
51
Multiple Choice
52
Multiple Choice
53
Multiple Choice
54
Multiple Choice
55
Multiple Choice
56
Multiple Choice

57
Multiple Choice

58
Multiple Choice

59
Multiple Choice

60
Multiple Choice

61
Multiple Choice

62
Multiple Choice

63
Multiple Choice

64
Multiple Choice

65
Multiple Choice

66
Multiple Choice

67
Multiple Choice

68
Multiple Choice
69
Multiple Choice

70
Multiple Choice

71
Multiple Choice

72
Multiple Choice

73
Multiple Choice

74
Multiple Choice

75
Multiple Choice

76
Multiple Choice
77
Multiple Choice

78
Multiple Choice

79
Multiple Choice

80
Multiple Choice

81
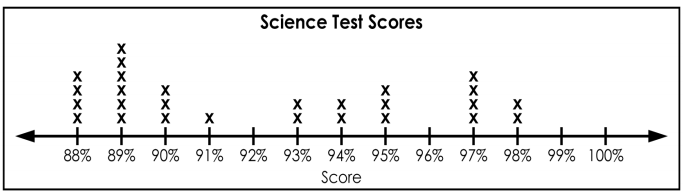
Multiple Choice

What shape is the data shown in the dot plot?
82
Multiple Choice
83
Multiple Choice

84
Multiple Choice

Part/total= %/100
85
Multiple Choice

Based on a recent survey of 500 students, the circle graph below shows how students communicate
with friends.
How many more students chose social media apps than phone calls to communicate with friends?
86
Multiple Choice
87
Multiple Choice
88
Multiple Choice

89
Multiple Choice

90
Multiple Choice

91
Multiple Choice

The process of collecting, analyzing, and interpreting non-numerical data.
92
Multiple Choice

Is information that has been translated into a form that is efficient for movement or processing.
93
Multiple Choice

The process of breaking a complex topic or substance into smaller parts in order to gain a better understanding?
94
Multiple Choice

A piece of information that is discovered during an official examination of a problem, situation.
95
Multiple Choice

A structured conversation where one participant asks questions, and the other provides answers.
96
Multiple Choice

Refers to how accurately a method measures what it is intended to measure.
97
Multiple Choice

Is defined as the probability that a product, system, or service will perform its intended function adequately for a specified period of time.
98
Multiple Choice
99
Multiple Choice

A reaction to a question, experience, or some other type of stimulus.
100
Multiple Choice

A method used to increase the credibility and validity of research findings.
101
Multiple Choice
102
Multiple Choice
103
Multiple Select
104
Multiple Choice
105
Multiple Choice
106
Multiple Choice
107
Multiple Choice
108
Multiple Choice
109
Multiple Choice
110
Multiple Choice
111
Multiple Choice

1. Which among the following research terms presents background information, scope and focus of research?
112
Multiple Choice
2. The research term that provides a review of what others have written or researched concerning the topic is referred to as ________.
113
Multiple Choice
3. What research term explains how the research was being conducted?
114
Multiple Choice
4. Among the following, which one presents the information gathered through the research?
115
Multiple Choice
5. Which of these evaluates the results of the study?
116
Multiple Choice
6. What research term provides the summary of the research?
117
Multiple Choice
7. The research term that lists all the sources used in research is__________.
118
Multiple Choice
8. Which of these contains other related information such as graphs, charts tables and lists of figures?
119
Multiple Choice
8. Which of these contains other related information such as graphs, charts tables and lists of figures?
120
Multiple Choice
9. Which one summarizes all sections and helps readers decide whether or not to read the entire report?
121
Multiple Choice
10. It is a systematic investigation to contribute to an existing body of knowledge.
122
Multiple Choice
123
Multiple Choice
124
Multiple Choice
125
Multiple Choice
126
Multiple Choice
127
Multiple Choice
128
Multiple Choice
129
Multiple Choice
130
Multiple Choice
131
Multiple Choice
132
Multiple Choice
133
Multiple Choice
What are observations that are measured or counted called?
Show answer
Auto Play
Slide 1 / 133
MULTIPLE CHOICE
