Compare Graphs/Tables/Equations
Presentation
•
Mathematics
•
8th Grade
•
Practice Problem
•
Medium

Taylor Harris
Used 2+ times
FREE Resource
7 Slides • 10 Questions
1
Comparing Graphs/Tables/Equations
2
How do you know if something is proportional between x and y?
-Graph: it must pass through the origin (0,0) and be a straight line
-Table: it must be a multiplicative relationship to get from x to y
-Equation: you cannot have an additive relationship....example: y = mx + b is NOT proportional; y = x -5 is NOT proportional; y = 2/3x IS proportional
3
Multiple Choice
Which table shows a proportional relationship between x and y?
4
Multiple Select
Select the three choices that show a proportional relationship between x and y.
y = 5/6x
y=3/8x + 2
5
Multiple Choice
Which graph shows the equation y = x + 2?
6
Do points sit on a line?
To figure out if points sit on a line, plug in the x values from each coordinate pair into the equation. You will get a y value. If the y value matches what is written in the coordinate pair, then yes, it will fall on the line.
For example, in y = 3x - 2, the coordinate pair (5, 13) is on the line, but (-2, 8) is NOT on the line.
7
Multiple Select
The equation of a line is y = -4x +2. Select all points that are on the line.
(0, 2)
(-1, -6)
(-2, 8)
(-3, 14)
(0.5, 0)
8
To figure out which table matches an equation...
Plug in the x values into the equation and see if the input/output table works.
If the equation is y = x + 5, this table would NOT work.
9
Multiple Choice
Which table matches the equation y = -2x - 3?
10
Multiple Choice
Which table contains values for the equation y = x - 1 ?
11
Multiple Choice
Which equation matches the table?
y = -2x
y = x + 18
y = 2x + 24
y = x + 22
12
To figure out which table matches a graph...
Test x and y values (they make coordinate pairs) on the graph
This table may have coordinate pairs of (0, 1),
(2, 2), (4, 3), and (-2, 0).
13
Multiple Choice
Which table matches the graph?
14
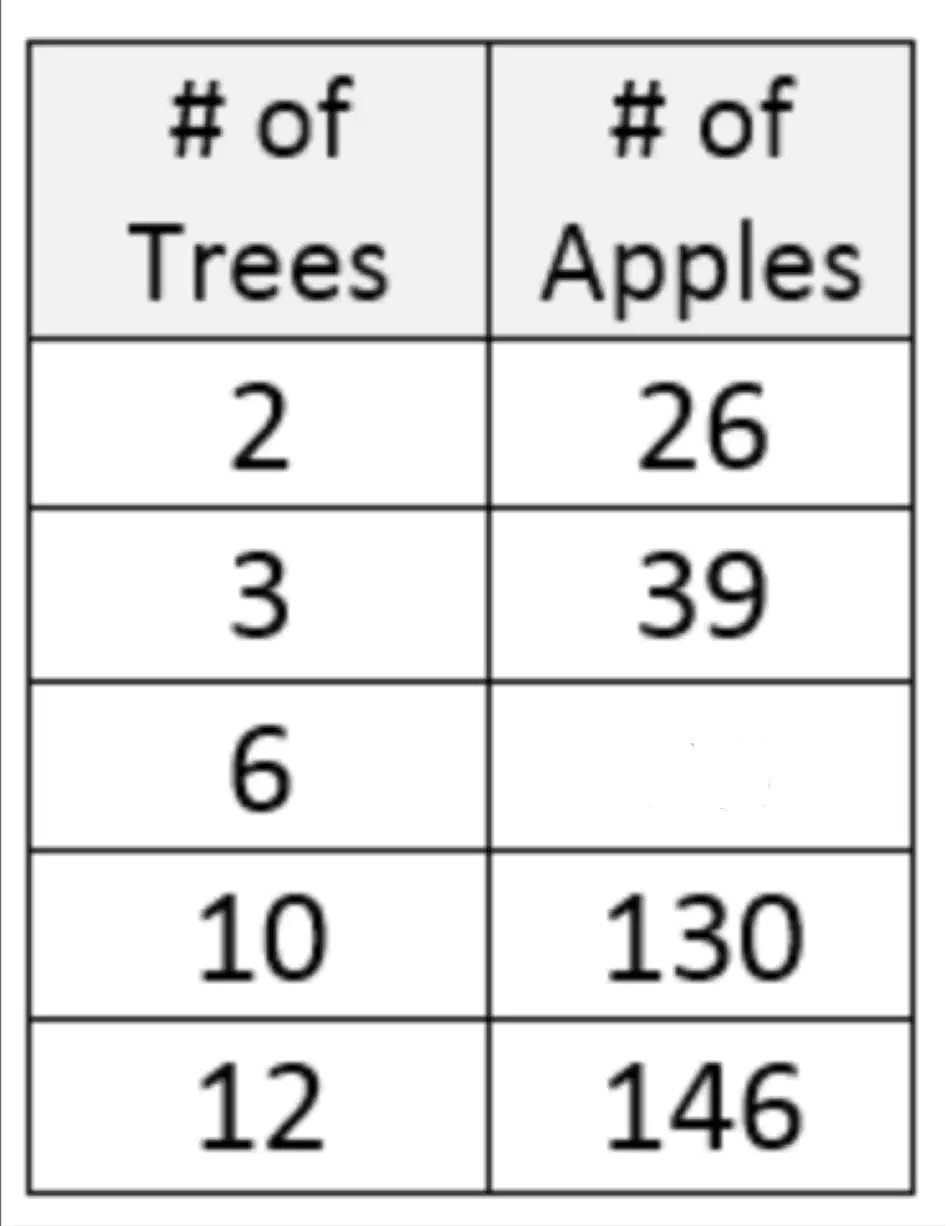
To figure out what number is missing...
Figure out the equation that shows the relationship between x and y. Then, plug in x or y into the equation (whichever one you have to find what is missing).
15
Fill in the Blanks
Type answer...
16
Connect tables, graphs, and equations
Use all of the skills you have learned to far to answer the next question!
Use coordinate pairs. Think of input/output tables as coordinate pairs. The x and y's correspond to each other if they are next to each other (in the same row).
17
Multiple Select
Identify the three representations that describe the relation shown in the table below.
y = 3x + 9
y = x + 5
{(-2, 3), (-1, 6), (0, 9), (1, 12), (2, 15)}
Comparing Graphs/Tables/Equations
Show answer
Auto Play
Slide 1 / 17
SLIDE

Similar Resources on Wayground
12 questions
Metric Conversions
Presentation
•
8th Grade
13 questions
Interpreting Graphs - Functions
Presentation
•
8th Grade
10 questions
Equations Of All Kinds!!!
Presentation
•
8th Grade
10 questions
Surface Area
Presentation
•
8th Grade
14 questions
Scatter Plots and Correlation
Presentation
•
8th Grade
10 questions
System of Equations
Presentation
•
8th Grade
14 questions
Transformation and Congruence Review
Presentation
•
8th Grade
12 questions
Laws of Exponents
Presentation
•
8th Grade
Popular Resources on Wayground
10 questions
GPA Lesson
Presentation
•
9th - 12th Grade
7 questions
Albert Einstein
Quiz
•
3rd Grade
31 questions
Bridge A Review
Quiz
•
3rd Grade
6 questions
Blue Sue and Red Ruth
Quiz
•
3rd Grade
8 questions
(Day12 HW) Inverse Trig Ratios
Quiz
•
9th Grade
20 questions
Summer Geometry QUIZ (Week3)
Quiz
•
9th Grade
16 questions
Theme Practice
Quiz
•
7th Grade
20 questions
Taxes
Quiz
•
9th - 12th Grade