
3/4 - All Regression Review
Presentation
•
Mathematics
•
9th Grade
•
Medium
+7
Standards-aligned

Nicole Richardson
Used 12+ times
FREE Resource
14 Slides • 9 Questions
1


2
Match

Match the following functions to their represented regression equation.
3

4

5


6

7
Multiple Choice

What is a line of best fit or curve of best fit used for?
8
Match

Match the correct type of function that appears to best fit the data for each graph shown.
9

10
Multiple Choice
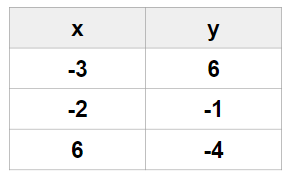
Write the linear regression equation for the following data points. Round to the nearest hundredth.
11
12
Multiple Choice
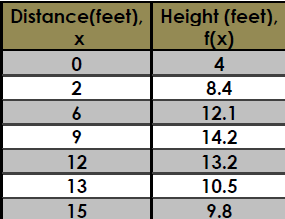
Find the quadratic equation for the relationship of the horizontal distance and the height of the ball.
13
14
Multiple Choice
15

16
Multiple Choice

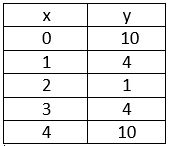
Which function best models the data?
17

18

19
20

21
22
Math Response
23
Open Ended

How can the STAAR Reference Sheet be used to help with information that is not evident?
Use complete sentences: I can use the STAAR Reference sheet...
Show answer
Auto Play
Slide 1 / 23
SLIDE
