
Shape and Spread
Presentation
•
Mathematics
•
9th - 12th Grade
•
Practice Problem
•
Hard
+6
Standards-aligned

TYRIAN JILLES
FREE Resource
3 Slides • 34 Questions
1

2

3

4
Multiple Choice

5
Multiple Choice

6
Multiple Choice
7
Multiple Choice

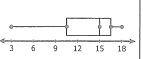
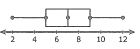
Describe the shape of the distribution.
8
Multiple Choice

Describe the shape of the distribution.
9
Fill in the Blanks
Type answer...
10
Multiple Choice
Which of the following best describes the shape of the distribution?
11
Multiple Choice

Which describes the shape of the distribution?
12
Multiple Choice

Which measure of center will be the smallest?
(Remember which one pulls toward the tail)
13
Multiple Choice
Which measure of spread should be used to describe the distribution?
14
Multiple Choice

Because this distribution is ____________ to the ___________, we would use the ______________ for the center and the _____________ for the spread of the data.
15
Multiple Choice

The dot plots show the gas mileage, in miles per gallon, for several cars and SUV's. Which type of vehicle has a larger spread?
16
Math Response
17
Multiple Choice
18
Multiple Choice

19
Multiple Choice

20
Multiple Choice

21
Multiple Choice

22
Multiple Choice

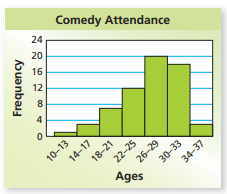
Which statement best describes this graph?
23
Multiple Choice

Which statement best describes the graph?
24
Multiple Select

What is shape of the data?
25
Multiple Choice

Which dot plot has a larger spread of data?
26
Multiple Choice

Which dot plot shows a larger spread of data?
27
Multiple Choice
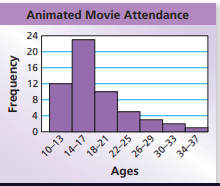
What is the shape of the data?
28
Multiple Choice
What is the shape of the data?
29
Multiple Select

Study the graph and determine one measure of center and one measure of variability that would best describe the data. (hint: are there outliers?)
30
Multiple Choice
31
Multiple Select
32
Multiple Choice

33
Multiple Choice

34
Multiple Choice
35
Multiple Select
36
Multiple Select
37
Multiple Choice

Show answer
Auto Play
Slide 1 / 37
SLIDE
