
7 - 4.1 Lesson 7 - Appropriate Measures of Center and Variation
Presentation
•
Mathematics
•
6th - 8th Grade
•
Medium

Abish Deter
Used 4+ times
FREE Resource
1 Slide • 8 Questions
1
Multiple Select
2
Multiple Select
3
4
Multiple Choice
5
Multiple Choice
6
Multiple Select
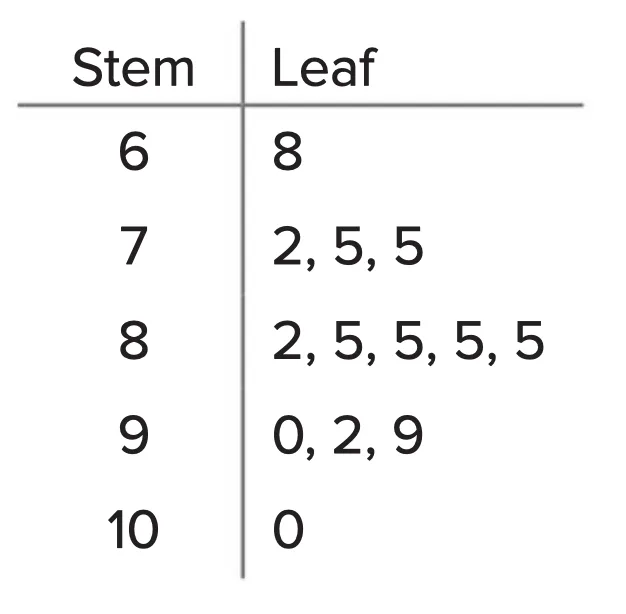
Which measurements would represent the BEST measures of center & variability for the data set shown?
7
Multiple Select
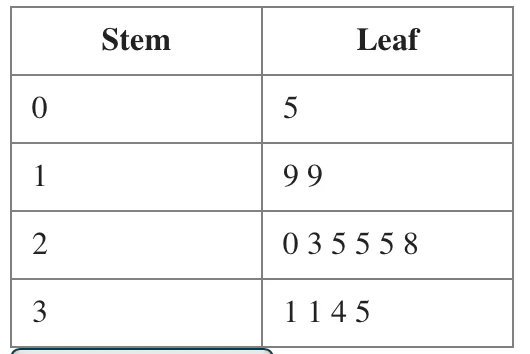
Which measurements would represent the BEST measures of center & variability for the data set shown?
8
Multiple Select
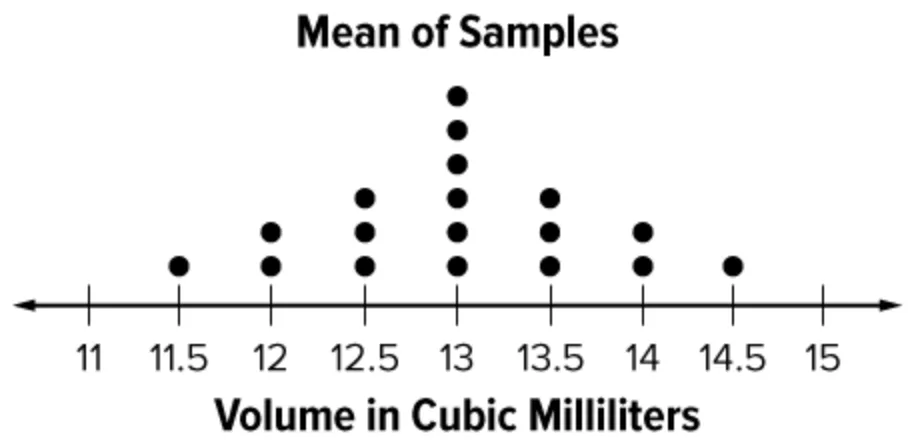
Study the graph and determine one measure of center and one measure of variability that would best describe the data.
9
Multiple Select
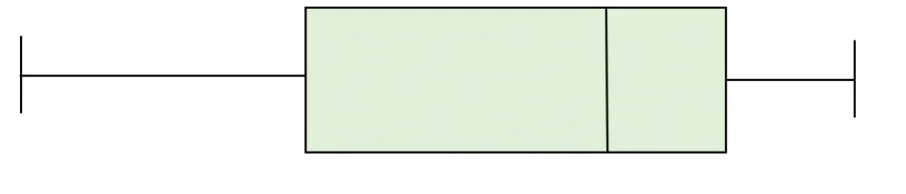
Study the graph and determine one measure of center and one measure of variability that would best describe the data. (hint: are there outliers?)
Show answer
Auto Play
Slide 1 / 9
MULTIPLE SELECT
