Search Header Logo
  1. Resource Library
  2. Math
  3. Data And Graphing
  4. Statistics
  5. Day Statistics Intro
Day Statistics intro

Day Statistics intro

Assessment

Presentation

Mathematics

6th - 8th Grade

Practice Problem

Medium

CCSS
6.NS.B.3, 6.SP.B.4, 6.SP.A.1

+5

Standards-aligned

Created by

Zaire O'Neil

Used 12+ times

FREE Resource

5 Slides • 15 Questions

1

What makes a Statistical Question?

  • Statistical questions are questions that can have more than on answer.

  • What is 2+2? Who is the leading scorer in MLB? What are the measurements of Northside MS,? None of these are statistical questions.

2

Multiple Choice

Which question is statistical?

1

How many visitors came to the museum each month last year?

2

What is the address of the museum?

3

What time does the museum open tomorrow?

3

Multiple Choice

Which question is statistical?

1

Where did you celebrate your last birthday?

2

What is the average age of my friends?

3

What are the ages of my friends' grandparents?

4

Line Plots

  • Displays the frequency of each data value in a data set.

  • Sometimes called a dot plot

  • The total number of xs or dots equals the total number of datat values in the set of data.

media

5

Multiple Choice

Question image

The line plot show the distances, in miles cyclists completed on Saturday. How many cyclists went at least 11 miles?

1

10

2

1

3

3

6

Multiple Choice

Question image

What is the maximum amount of goals scored?

1

3

2

1

3

0

4

7

7

Multiple Choice

Question image
1
2
3
4

8

Histograms

  • histogram is a graphical display of data using bars of different heights.

  • In a histogram, each bar groups numbers into ranges (or bins)

media

9

Multiple Choice

Question image

How many people at the bowling alley were ages 6 to 25

1

12

2

5

3

7

4

16

10

Fill in the Blanks

media image

Type answer...

11

Multiple Choice

Question image

How many times did she practice for less than 30 minutes?

1

13

2

9

3

12

4

17

12

media

13

Multiple Choice

Question image

Describe the distribution of the data.

1

Skewed left or negative skew

2

Skewed right or positive skew

3

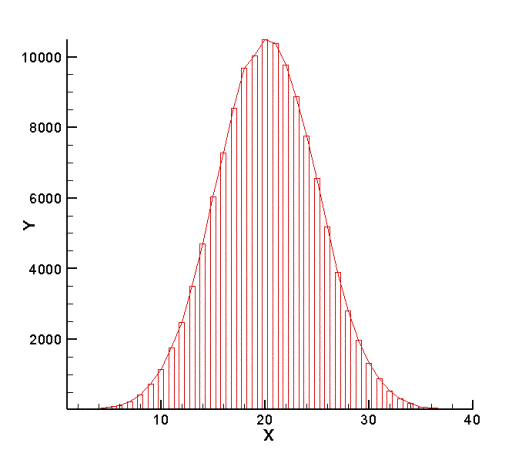
Skew normal or normal distribution

4

No skew

14

Multiple Choice

Question image

Describe the distribution of the data.

1

Skewed left or negative skew

2

Skewed right or positive skew

3

Skew normal or normal distribution

4

No skew

15

Multiple Choice

Question image

How would you describe this distribution?

1

Left skewed

2

Uniform

3

Right Skewed

4

Symmetrical

16

Multiple Choice

Question image

Describe the histogram:

1

Left Skewed

2

Normal/Symmetrical

3

Right Skewed

4

Uniform/Flat

17

Multiple Choice

Question image
How many students have more than 1,000 songs on their MP3 player?
1
5
2
16
3
10
4
4

18

Multiple Choice

Question image

Which interval has 400 employees?

1

33-43

2

0-10

3

77-87

4

66-76

19

​Talley/Frequency Charts

  • An organized way to collect your data.

  • Shows how often one data point appears in a data set.

  • Frequency charts change tally charts into a numerical format.

media

20

Multiple Choice

Question image

What is the frequency for the number of weeks that had only 4 days of rain?

1

4

2

6

3

19

4

15

What makes a Statistical Question?

  • Statistical questions are questions that can have more than on answer.

  • What is 2+2? Who is the leading scorer in MLB? What are the measurements of Northside MS,? None of these are statistical questions.

Show answer

Auto Play

Slide 1 / 20

SLIDE