
SOL Review: Scientific Investigation
Presentation
•
Biology
•
9th - 12th Grade
•
Medium
+11
Standards-aligned

Kerry Dabbs
Used 12+ times
FREE Resource
13 Slides • 36 Questions
1

2

3
Multiple Choice
4

5

6

7
Multiple Choice
8
Multiple Choice
9

10

11
Multiple Choice
12
Multiple Choice
13
Multiple Choice
14
Multiple Choice
15
Multiple Choice
16
Multiple Choice
17
Multiple Select

If Row (1) is correct for this graph, choose the things that are true
18

19
20
Multiple Choice
21
Multiple Choice
22
23
Multiple Choice
24


25
Open Ended

If the outcomes for each group are as follows, propose an appropriate CONCLUSION:
Group A Reaction time: 0.968 seconds
Group B Reaction time: 0.688 seconds
26
Open Ended
27
Match
28
Multiple Choice
29
Labelling
30
31
Multiple Choice

Doubling the amount of sunlight from 3 to 6 hours always doubles the plant growth
32
Multiple Choice

According to this graph, the trend shows
33
Multiple Choice

According to this graph, the general trend in drink consumption is
34
Multiple Choice
35
Multiple Choice
36
Multiple Choice
37
Multiple Choice

38
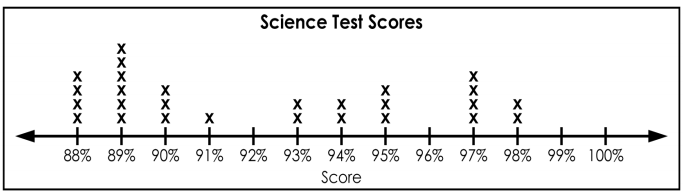
Multiple Choice

How many students received a score of 94%?
39
Multiple Choice

What is the difference between the shortest and the longest distance of the baseball thrown?
40
Multiple Choice
41
Multiple Choice
42
43
Multiple Choice
44
Multiple Choice
45
Multiple Choice
46
Open Ended
47
Open Ended
48
Open Ended
49
Categorize
Show answer
Auto Play
Slide 1 / 49
SLIDE
