
UNIT TEST MATH 7 WEEK 1-5
Presentation
•
Mathematics
•
7th Grade
•
Practice Problem
•
Hard
+17
Standards-aligned

Jacqueline Naranja
Used 2+ times
FREE Resource
4 Slides • 35 Questions
1

2
3
4
5
Multiple Choice
6
Multiple Choice
7
Multiple Choice
8
Multiple Choice
9
Multiple Choice
10
Multiple Choice
11
Multiple Choice
12
Multiple Choice
13
Multiple Choice
14
Multiple Choice
15
Multiple Choice
16
Multiple Choice
17
Multiple Choice
18
Multiple Choice
19
Multiple Choice
20
Multiple Choice
21
Multiple Choice
22
Multiple Choice
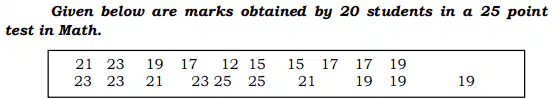
What is the total frequency of the given data?
23
Multiple Choice
How many students got a mark of 25?
24
Multiple Choice
How many students got the lowest score in Math test?
25
Multiple Choice
26
Multiple Choice
27
Multiple Choice
28
Multiple Choice
29
Multiple Choice
30
Multiple Choice
31
Multiple Choice
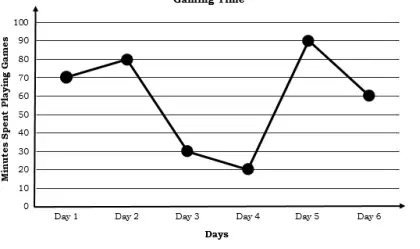
Which day did Johnny spend the most of time playing games?
32
Multiple Choice
Which day did Johnny spend the most of time playing games?
33
Multiple Choice
What is the total time he spent playing games?
34
Multiple Choice
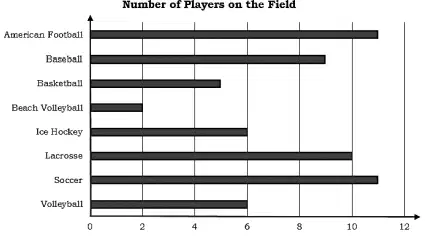
Which sport type has the least number of players?
35
Multiple Choice
Which sport type has 9 players?
36
Multiple Choice
Which sports have the same number of players?
37
Multiple Choice
How many less players does lacrosse team have than the soccer team?
38
Multiple Choice
39
Multiple Choice
Show answer
Auto Play
Slide 1 / 39
SLIDE
