Lesson 25 Eureka
Presentation
•
Mathematics
•
6th Grade
•
Medium
+4
Standards-aligned
Eden Westergaard
Used 2+ times
FREE Resource
1 Slide • 11 Questions
1
How can we use tables, graphs, and equations to represent relationships between quantities and to solve real-world problems?
Lesson 25
page 355
2
Multiple Choice
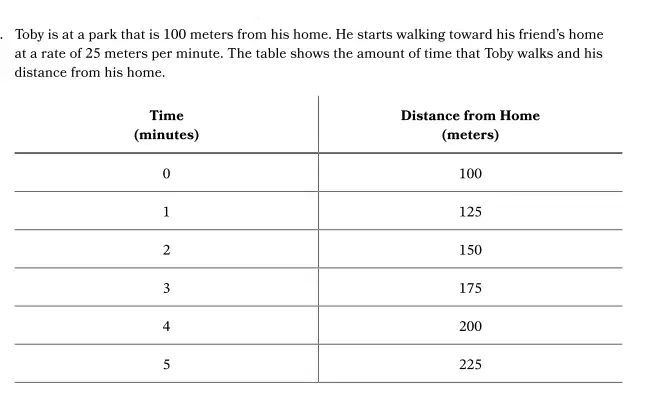
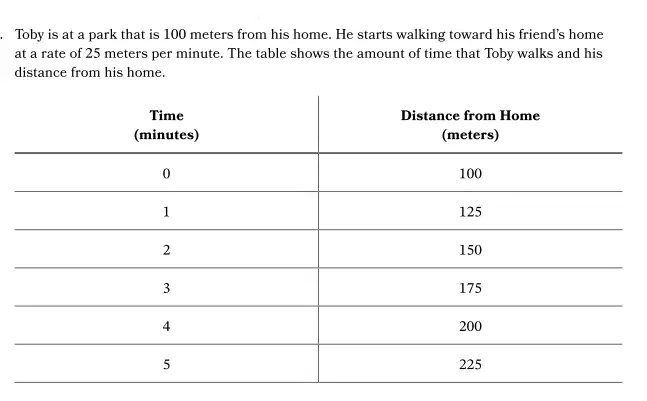
What is the rate at which Toby is walking towards his friend's home?
20 meters per minute
25 meters per minute
30 meters per minute
35 meters per minute
3
Multiple Choice
How far will Toby be from his home after 3 minutes of walking?
150 meters
175 meters
200 meters
225 meters
4
Multiple Choice
Identify the independent variable in the scenario where Toby walks from his home to his friend's home.
Toby's speed
Time in minutes
Distance from home in meters
Toby's friend's location
5
Multiple Choice
What is the dependent variable in the scenario described?
Time in minutes
Toby's walking speed
Distance from home in meters
Number of steps Toby takes
6
Multiple Choice
What does the variable 'y' represent in the equation y = 100 + 25x?
The time Toby walks in minutes
The distance Toby is from his home in meters
The speed of Toby's walk in meters per minute
The number of steps Toby takes
7
Draw
Add to the picture
8
Multiple Choice
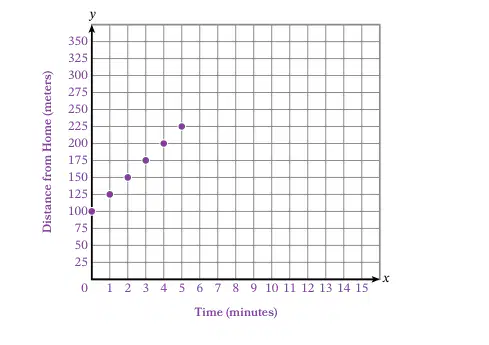
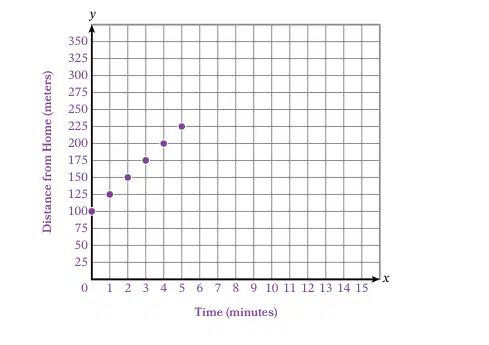
What is the scale used for the y-axis in the graph?
1 unit = 25 meters
1 unit = 50 meters
1 unit = 75 meters
1 unit = 100 meters
9
Multiple Choice
What is the scale used for the x-axis in the graph?
1 unit = 1 minute
1 unit = 2 minutes
1 unit = 5 minutes
1 unit = 10 minutes
10
Multiple Choice
What is the relationship shown in the graph where the x-axis represents the number of hours and the y-axis represents money earned (in dollars)?
The more hours worked, the less money earned.
The relationship between hours worked and money earned is not clear.
The more hours worked, the more money earned.
There is no relationship between hours worked and money earned.
11
Multiple Choice
Sarah is bringing treats to her elementary school class on her birthday. The number of treats she brings in is based on the number of students in her class.
t = the number of treats
s = the number of students
Which of the variables is INDEPENDENT?
s
t
12
Poll
How well do you feel you understand variables?
I've got this!
How can we use tables, graphs, and equations to represent relationships between quantities and to solve real-world problems?
Lesson 25
page 355
Show answer
Auto Play
Slide 1 / 12
SLIDE

Similar Resources on Wayground
11 questions
Ratios and Proportions Review
Presentation
•
6th Grade
9 questions
Mean and Mode
Presentation
•
6th Grade
11 questions
Calculating & Graphing Speed
Presentation
•
6th - 7th Grade
8 questions
Distributive Property
Presentation
•
6th Grade
11 questions
Graphical Representations of Data
Presentation
•
6th Grade
10 questions
Comparing and ordering integers
Presentation
•
5th - 6th Grade
9 questions
Geometry Vocab
Presentation
•
6th - 7th Grade
8 questions
Write Expressions
Presentation
•
6th Grade
Popular Resources on Wayground
10 questions
HCS SCI 03 Summer School Assessment 1
Quiz
•
3rd Grade
15 questions
HCS SCI 05 Summer School Assessment 1 Review
Quiz
•
5th Grade
22 questions
Day 9 Equations and Inequalities Review
Quiz
•
9th Grade
10 questions
Writing and Identifying Ratios Practice
Quiz
•
5th - 6th Grade
7 questions
PYRAMID PERSPECTIVES part 1
Presentation
•
9th - 12th Grade
12 questions
Understanding the Fourth of July
Quiz
•
9th Grade
15 questions
Soccer World Cup Quiz Questions
Quiz
•
7th Grade