Search Header Logo
  1. Resource Library
  2. Math
  3. Data And Graphing
  4. Types Of Graphs
  5. Data Different Types Of Graphs
Data- different types of graphs

Data- different types of graphs

Assessment

Presentation

Mathematics

6th - 8th Grade

Practice Problem

Medium

CCSS
6.NS.B.3, 6.SP.B.4, 3.MD.B.3

+3

Standards-aligned

Created by

Karla O'Neal

Used 33+ times

FREE Resource

12 Slides • 12 Questions

1

Data Analysis (5.9A)

​I can represent categorical data with bar graphs or frequency tables and numerical data.

media

2

What types of graphs do you know?

3

media

4

Multiple Choice

What type of graph/chart did I just show you?

1

Pie Chart

2

Bar Graph

3

Scatter Plot

4

Dot Plot

5

Frequency Chart

5

Bar Graphs

  • a chart that plots data using rectangular bars 

  • or columns 

  • uses bars

  • Can be Horizontal or Double

media

6

Multiple Choice

Question image

How many voted for Mint?

1

89

2

57

3

37

4

28

7

media

8

Multiple Choice

What type of graph/chart did I just show you?

1

Pie Chart

2

Bar Graph

3

Scatter Plot

4

Dot Plot

5

Frequency Chart

9

Pie Chart

  • is a circular graph, which is divided into slices to illustrate numerical proportion

  • shows percentages or parts of data collected

media

10

Multiple Choice

Question image

What percentage chose Oatmeal Cream Pies?

1

21%

2

4%

3

6%

4

15%

11

Multiple Choice

What type of graph/chart did I just show you?

1

Pie Chart

2

Bar Graph

3

Scatter Plot

4

Dot Plot

5

Frequency Chart

12

media

13

Frequency Tables

  • Frequency refers to the number of times an event or a value occurs.

  • A frequency table is a table that lists items and shows the number of times the items occur.

media

14

Multiple Choice

Question image

How many times was 5 rolled?

1

2

2

3

3

6

4

1

15

media

16

Multiple Choice

What type of graph/chart did I just show you?

1

Pie Chart

2

Bar Graph

3

Scatter Plot

4

Dot Plot

5

Frequency Chart

17

Dot Plot

  • a type of graphic display using dots and a simple scale to compare the counts within categories or groups

media

18

Multiple Choice

Question image

How many students have 3 or more siblings?

1

10

2

6

3

3

4

4

19

media

20

Multiple Choice

What type of graph/chart did I just show you?

1

Stem-and-Leaf

2

Bar Graph

3

Pie Chart

4

Dot Plot

5

Pictograph

21

Stem-and-Leaf Plot

  • plot where each data value is split into a "leaf" (usually the last digit) and a "stem" (the other digits).

media

22

Multiple Choice

Question image

What number is NOT included on the Stem-and-Leaf Plot?

1

63

2

56

3

1

4

74

23

Multiple Choice

Question image
How many students had more than 6 candy bars?
1

5

2

2

3

3

4

1

24

Multiple Choice

Question image
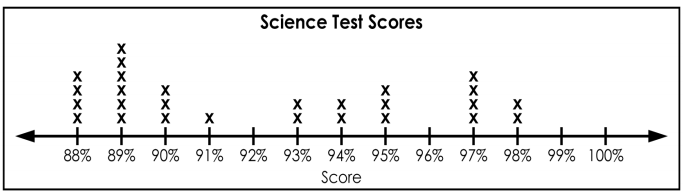
How many total students are in the science class?
1

13

2

6

3

27

4

25

Data Analysis (5.9A)

​I can represent categorical data with bar graphs or frequency tables and numerical data.

media

Show answer

Auto Play

Slide 1 / 24

SLIDE