
Measures of Center & Spread
Presentation
•
Mathematics
•
9th - 12th Grade
•
Hard
+1
Standards-aligned

Amy Warner
FREE Resource
2 Slides • 24 Questions
1

2
Multiple Select
3
Multiple Select
4
5
Multiple Choice
6
Multiple Choice
7
Multiple Select
8
Multiple Select
9
Drag and Drop

10
Multiple Select

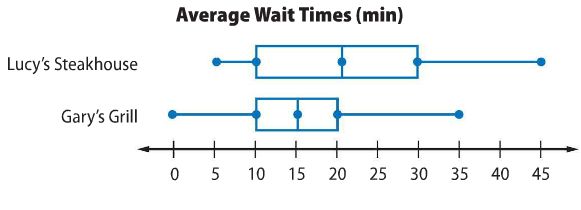
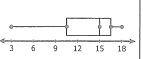
Study the graph and determine one measure of center and one measure of variability that would best describe the data. (hint: are there outliers?)
11
Multiple Choice

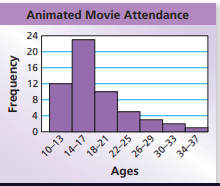
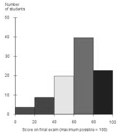
What type of shape distribution would you say this graph has?
12
Multiple Choice

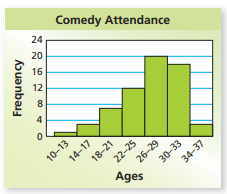
What type of shape distribution would you say this graph has?
13
Multiple Choice

What type of shape distribution would you say this graph has?
14
Multiple Choice

How would you describe the shape of this distribution?
15
Multiple Choice
What is the shape of the data?
16
Multiple Choice
What is the best description of the given data?
17
Multiple Choice
18
Multiple Choice
19
Multiple Choice
20
Multiple Choice
How would you describe this data?
21
Multiple Choice

What is the best description of the data?
22
Multiple Choice

Which is the best description of the data?
23
Multiple Choice
Which of the following best describes the shape of the distribution?
24
Multiple Choice

What is the best measure of the center for this data?
25
Multiple Choice
What is the best measure of the center of the data
26
Multiple Choice

What is the best description of the data
Show answer
Auto Play
Slide 1 / 26
SLIDE
