Search Header Logo
Dot Plots

Dot Plots

Assessment

Presentation

Mathematics

6th - 8th Grade

Medium

Created by

Stacy Gray

Used 2+ times

FREE Resource

11 Slides • 20 Questions

1

Lesson 13.2A - Dot Plots

media
media

2

Dot Plots

  1. Sometimes called line plot

  2. Shows the frequency of data along a number line

  3. a data value is represented by a dot above the corresponding value on the number line

  4. the number of dots above each value indicate the frequency of that value

3

Dot Plots

Each dot in a dot plot is a data point plotted along a horizontal axis. Duplicate values are stacked. In this plot, there are 50 data values represented. The value 6 is present 4 times in the set.

media

4

Please answer the next three questions

Thank you!

5

Multiple Choice

Question image

What is the highest score in the class?

1

88%

2

100%

3

13

4

98%

6

Multiple Choice

Question image

How many students spent 7 hours doing homework that week?

1

1

2

3

3

5

4

6

7

Multiple Choice

Question image

How many students read no books (zero) last summer?

1

6

2

1

3

4

4

3

8

Dot Plots

media

9

Please answer the next six questions

Thanks again!

10

Multiple Choice

Question image

How many people have 4 or more pets?

1

8

2

3

3

6

4

4

11

Multiple Choice

Question image

How many students scored 93% or less?

1

6

2

16

3

14

4

13

12

Multiple Choice

Question image

How many students scored between 95 and 100?

1

6

2

6

3

9

4

14

13

Multiple Choice

Question image

How many students received a score in the 80's?

1

2

2

10

3

14

4

27

14

Multiple Choice

Question image

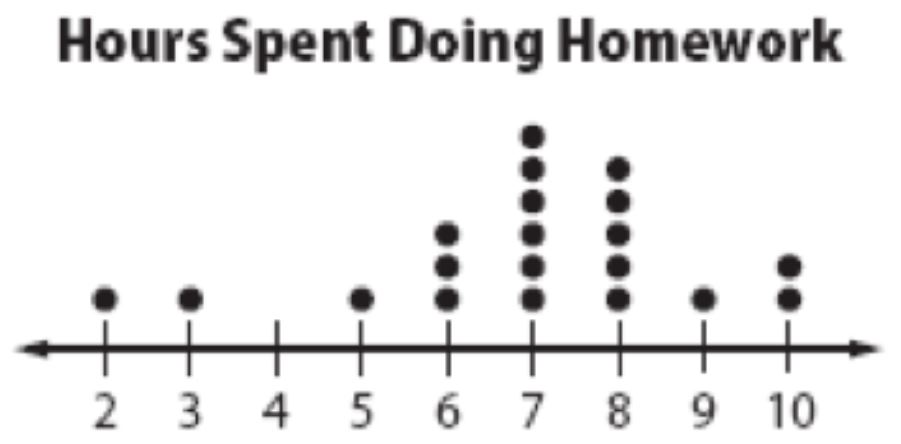
What is the greatest amount of time a student spent doing his homework?

1

2 hours

2

1 hour

3

6 hours

4

10 hours

15

Multiple Choice

Question image

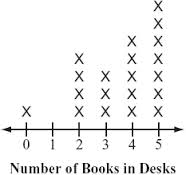
How many people have two or less books in their desk?

1

4

2

5

3

6

4

7

16

Multiple Choice

Question image

The dot plot shows the number of people in the vehicles that passed through a security checkpoint in a particular minute.

How many vehicles passed through the security checkpoint?

1

20

2

5

3

21

4

19

17

Multiple Choice

Question image

The dot plot shows the number of people in the vehicles that passed through a security checkpoint in a particular minute.

Find the total number of people who have passed through the security checkpoint in that minute.

1

50

2

56

3

20

4

60

18

Multiple Choice

Question image

The dot plot shows the number of people in the vehicles that passed through a security checkpoint in a particular minute.

What percent of vehicles had more than 3 people?

1

15%

2

80%

3

20%

4

30%

19

Multiple Choice

Question image

The dot plot shows the number of people in the vehicles that passed through a security checkpoint in a particular minute.

Find the mean number of people.

1

3

2

2.8

3

4

4

2

20

Multiple Choice

Question image

The dot plot shows the number of people in the vehicles that passed through a security checkpoint in a particular minute.

Find the median number of people.

1

3

2

2

3

2.5

4

2.8

21

Building a Dot Plot

Building a dot plot is just a matter of plotting data points on a number line and stacking any duplicates. It's important that your number line be evenly spaced, so it's alright for there to be gaps. Include all numbers even if they aren't represented in the data set.

22

Building a Dot Plot

Create a number line that will fit all the data and place a dot above the number for each value in the data set.

media

23

Choose the dot plot that best matches the data.

24

Multiple Choice

Question image
1
2
3
4

25

Open Ended

Question image

Briefly describe the distribution of data.

What is one thing that you observe?

26

Outlier

An extreme value which is much greater or smaller than the rest of the data.

media

27

Fill in the Blank

28

Putting it all together

29

Math Response

Joseph recorded the daily temperature outside his house at noon for 13 days. the temperatures in F are as follows (see image).

What is the mean temperature?

Type answer here
Deg°
Rad

30

Draw

Look on page 209 of your textbook.

Display the data in Try It #7 in a dot plot.

You won't have room to add 50 to the line so since it is an outlier don't include it.

Start your number line with 54

31

Open Ended

Question image

Briefly describe the distribution of data

Lesson 13.2A - Dot Plots

media
media

Show answer

Auto Play

Slide 1 / 31

SLIDE