
Categorical, Numerical Data - Dot plots, Median
Presentation
•
Mathematics
•
6th - 8th Grade
•
Practice Problem
•
Medium
+2
Standards-aligned

Jennifer Taylor
Used 3+ times
FREE Resource
9 Slides • 12 Questions
1

2
3

4

5
6

7

8
Multiple Choice
9
Multiple Choice
10
Multiple Choice
11
Multiple Choice
12

13


14
Multiple Select

What is the shape of the dot plot shown?
15
Multiple Choice
How many total students were surveyed about their number of brothers and sisters? (add up all of the dots)
16
Multiple Choice

How many students have a shoe size bigger than 8?
17
Multiple Choice

18
Multiple Choice
19
Multiple Choice
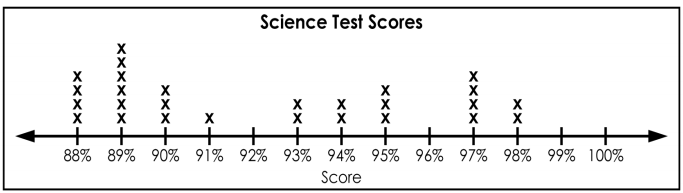
What is the median of the data?
20
Multiple Choice
21
Multiple Choice

Show answer
Auto Play
Slide 1 / 21
SLIDE
Similar Resources on Wayground

17 questions
Circles Refresher
Lesson
•
6th - 8th Grade
15 questions
Area and Surface Area
Lesson
•
6th - 8th Grade
14 questions
Subtracting Rational Numbers
Lesson
•
6th - 8th Grade
16 questions
My Media Use
Lesson
•
6th - 8th Grade
15 questions
Unit Rates with Complex Fractions
Lesson
•
6th - 8th Grade
14 questions
Solving two step equations
Lesson
•
6th - 8th Grade
19 questions
Integers
Lesson
•
6th - 8th Grade
19 questions
Perfect Squares and Square Roots
Lesson
•
6th - 8th Grade
Popular Resources on Wayground
15 questions
Fractions on a Number Line
Quiz
•
3rd Grade
20 questions
Equivalent Fractions
Quiz
•
3rd Grade
25 questions
Multiplication Facts
Quiz
•
5th Grade
29 questions
Alg. 1 Section 5.1 Coordinate Plane
Quiz
•
9th Grade
22 questions
fractions
Quiz
•
3rd Grade
11 questions
FOREST Effective communication
Lesson
•
KG
20 questions
Main Idea and Details
Quiz
•
5th Grade
20 questions
Context Clues
Quiz
•
6th Grade
Discover more resources for Mathematics
36 questions
6th Grade Math STAAR Review
Quiz
•
6th Grade
14 questions
Volume of rectangular prisms
Quiz
•
7th Grade
14 questions
finding slope from a graph
Quiz
•
8th Grade
20 questions
Graphing Inequalities on a Number Line
Quiz
•
6th - 9th Grade
23 questions
Solve and Graph Inequalities
Quiz
•
6th Grade
15 questions
Distributive Property & Review
Quiz
•
6th Grade
10 questions
Mean, Median, Mode, and Range
Quiz
•
7th Grade
17 questions
Area of a parallelogram
Quiz
•
6th Grade