Search Header Logo
Unit 1:  Statistics (Lesson/Review)

Unit 1: Statistics (Lesson/Review)

Assessment

Presentation

Mathematics

6th Grade

Easy

CCSS
6.SP.B.4, 6.SP.B.5C, 6.SP.B.5D

+22

Standards-aligned

Created by

Jennifer Katz

Used 6+ times

FREE Resource

1 Slide • 70 Questions

1

Unit 1: Statistics
End of Unit Review

2

Fill in the Blanks

3

Open Ended

What makes a question a statistical question?

4

Multiple Choice

How far from school do students live?

1

Statistical Question

2

NOT a Statistical Questions

5

Multiple Choice

Choose the statistical question.

1

Who has the most scrunchies in the class?

2

How many scrunchies does Ava have?

3

How many scrunchies does each girl in the 6th grade have?

4

How many students in the class have more than 5 scrunchies?

6

Fill in the Blanks

7

Open Ended

What are the two types of data that we studied?

8

Fill in the Blanks

9

Multiple Choice

What word best describes the MEAN?

1

Difference

2

Average

3

Middle

4

Most

10

Multiple Choice

What is the mean of these numbers?
4,5,5,2,3,3,2,8
1
40
2
24
3
4
4
256

11

Multiple Choice

What word best describes the MEDIAN?

1

Difference

2

Average

3

Middle

4

Most

12

Multiple Choice

What is the median of this data set?
7.3, 2.9, 1.5, 0.6, 3.8
1
2.9
2
3
3
3.5
4
4.3

13

Multiple Choice

Compute the Median:
3, 5, 7, 4, 3, 1

1
3 and 4
2

None

3
3.5
4
3

14

Multiple Choice

What word best describes the MODE?

1

Difference

2

Average

3

Middle

4

Most

15

Fill in the Blanks

media image

16

Multiple Choice

The mode score on the 6th grade math test was 94! Which of these interpretations must be correct?
1
99 was the highest score on the test.
2

More students received a 94 than any other score.

3

No student scored below a 50.

4
A score of 91 was slightly below average.

17

Multiple Choice

What is the mode or modes in this set of numbers:
7, 14, 20, 3, 7, 14, 2, 14, 7

1
7
2
20
3
7 & 14
4

None

18

Multiple Choice

What is the Mode or Modes for this data set?

1, 1, 2, 2, 3, 3, 4, 4

1

1

2

1 and 2

3

1, 2, 3 and 4

4

None

19

Multiple Choice

What word best describes the RANGE?

1

Difference

2

Average

3

Middle

4

Most

20

Multiple Choice

Question image

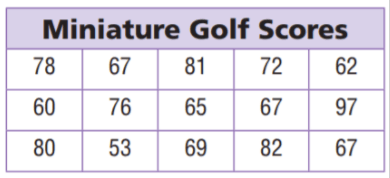
What is the range of miniature golf scores?

1

44 points

2

29 points

3

33 points

4

39 points

21

Fill in the Blanks

22

Multiple Choice

Which measure of center best represents this set of data?


red, blue, red, yellow, red, green, black, red, white, red, red

1
Mean
2
median
3
mode

23

Multiple Choice

What measure of center is best to use when we have outliers?

1

mean

2

median

3

mode

4

range

24

Multiple Choice

Which measure of center best represents this set of data?

12, 13, 11, 16, 81, 14, 10, 15

1
Mean
2
median
3
mode

25

Multiple Choice

Which measure of center best represents this set of data?

12, 24, 20, 15, 15, 12, 24, 24, 21, 13, 14

1
Mean
2
median
3
mode

26

Multiple Choice

If the outlier is removed from the following data set would the mean INCREASE (go up) or DECREASE (go down)?

22, 19, 22, 21, 1

1

The Mean would INCREASE

2

The Mean would DECREASE

27

Fill in the Blanks

Type answer...

28

Fill in the Blanks

media image

29

Fill in the Blanks

media image

30

Fill in the Blanks

media image

31

Multiple Choice

Question image

Identify the gap of the data.

1

1 to 5

2

3 to 5

3

6 to 9

4

1 to 10

32

Multiple Choice

Question image

What was the day with the most amount of cars sold?

1

Monday

2

Tuesday

3

Thursday

4

Friday

5

Saturday

33

Multiple Choice

Question image

How many cars were sold on Thursday and Friday

1

6

2

7

3

8

4

9

34

Multiple Choice

Question image

How many students had at least 7 candy bars?

1
5
2
2
3
3
4
1

35

Multiple Choice

Question image

Is the dot plot symmetrical?

HINT: Symetrical means that it is evenly distributed around the middle.

1

Yes

2

No

36

Multiple Choice

Question image

How many total students were surveyed about their number of brothers and sisters?

1

15

2

10

3

6

37

Multiple Choice

Question image

What is the mode of the data?

1

2

2

1

3

4

4

12

38

Multiple Choice

Question image

What was the day with the least amount of cars sold?

1

Monday

2

Tuesday

3

Wednesday

4

Thursday

5

Sunday

39

Multiple Choice

Question image

How many students scored 93% or less?

1

6

2

16

3

14

4

13

40

Fill in the Blanks

41

Multiple Choice

Question image
Which interval has the greatest number of employees?
1
11-21
2
33-43
3
77-87
4
44-54

42

Multiple Choice

Question image
How many people watched more than 6 hours of TV?
1
10
2
5
3
20
4
17

43

Multiple Choice

Is a histogram the same as a bar graph?
1
No, because a histogram displays numerical data while a bar graph displays categorical data.
2

Yes, because they both use separate bars to display data.

44

Multiple Choice

Question image
How many cities have temperatures between 70 degrees and 99 degrees?
1
44
2
34
3
26
4
62

45

Multiple Choice

Question image
What is an interval?
1
A single number
2
A range of numbers
3
A percentage
4
A total amount

46

Multiple Choice

Question image

If Raul measured another tree in the orchard, which is most likely the height of the tree based on the information in the Histogram?

1
12 feet
2
21 feet
3
3 feet
4
19 feet

47

Multiple Choice

Question image
How many people were polled?
1
33
2
6
3
35
4
4

48

Fill in the Blanks

49

Multiple Choice

First step for finding the median is to order the numbers from least to greatest?

1

True

2

False

50

Drag and Drop

Quartiles break the data set into

equal parts each representing 25% or 1/4 of the data.
Drag these tiles and drop them in the correct blank above

1

2

3

4

51

Multiple Choice

IQR = Q3 - Q1

1

True

2

False

52

Multiple Choice

What is the Q1, Median (Q2), and Q3 of the following data set?

4, 5, 6, 8, 9, 10, 11

1

Q1: 4

Q2: 8

Q3: 11

2

Q1: 5

Q2: 8

Q3: 10

3

Q1: 4

Q2: 5

Q3: 6

53

Multiple Choice

What is the IQR of the following data set:

4, 5, 6, 8, 9, 10, 11

1

5

2

6

3

7

4

There is not enough information

54

Multiple Choice

Find the lower quartile (Q1) of the following set of scores:

6, 7, 8, 9, 11, 13, 15

1
13
2

7

3
9
4
6

55

Fill in the Blanks

56

Fill in the Blanks

57

Multiple Choice

Question image

Students recorded the amount of minutes they spend watching TV.

What is the lower quartile (Q1)?

1

30

2

24

3

60

4

78

58

Multiple Choice

Question image

The faculty of ECMS were asked to state their age. The results are shown in the box plot.

What is the minimum age found in the box plot?

1

23

2

33

3

42

4

20

59

Multiple Choice

Question image

Mrs. Katz, Mrs. Ledesma, and Mrs. Butler, gathered every 6th grade math score on the test they took, which is shown in the box plot.

What is the median score the 6th grade students received?

1

64

2

70

3

84

4

72

60

Multiple Choice

Question image

The box plot shows the length of time (minutes) children spent in the swimming pool.

What is maximum amount of time the children spent in the swimming pool?

1

95

2

70

3

77.5

4

50

61

Multiple Choice

Question image

Students were asked how many minutes they spent reading last night for ELA.

Using the box plot, what is the Upper Quartile (Q3)?

1

47.5

2

40

3

75

4

50

62

Multiple Choice

Question image

Based on the box plot, how do I find the IQR?

1

45 - 33

2

45 + 33

3

23 + 58

4

58 - 23

63

Multiple Choice

Question image
What percentage of the data is between 90 and 140?
1

25%

2
50%
3
75%
4
100%

64

Multiple Choice

Question image

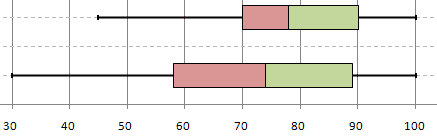
What fraction of the data is between 90 and 140?

1

1/4

2

2/4 or 1/2

3

3/4

4

4/4 or

1 whole

65

Multiple Choice

Question image
True of false, 75% of the data values are greater than 18?
1
True
2
False, 75% of the values are greater than 16
3
False, 50 % of the values are greater than 18
4
False, 25% of the values are greater than 18

66

Multiple Choice

Question image
Which box and whisker plot has the highest median?
1

Top

2

Bottom

67

Multiple Choice

What do you do if there are two numbers in "the middle" when you are finding the median?
1
Pick your favorite number
2
Add the two numbers in the middle & then divide by two.
3
They are both the median
4
None of the above

68

Multiple Choice

Question image
What percent of students have a height between 58 inches and 60 inches?
1
25%
2
50%
3
75%
4
100%

69

Multiple Choice

Question image

Which statement is NOT true based on the Box Plot?

1

The median test score is 80.

2

The lower quartile is 65.

3

The upper quartile is 90.

4

The IQR is 30.

70

Multiple Choice

Question image

What fraction of the data is between 40 and 90?

1

1/4

2

2/4 or 1/2

3

3/4

4

4/4 or

1 whole

71

Multiple Choice

Question image

What percent of the data is between 30 and 35 on the number line?

1

25%

2

50%

3

75%

4

100%

Unit 1: Statistics
End of Unit Review

Show answer

Auto Play

Slide 1 / 71

SLIDE