
Scatterplots
Presentation
•
Mathematics
•
9th - 12th Grade
•
Medium
•
CCSS.6.NS.B.3, 8.11.A, CCSS.HSS.ID.B.5
+4
Standards-aligned

Chris Robinson
Used 4+ times
FREE Resource
7 Slides • 10 Questions
1
2

3

4

5

6

7

8
Dropdown

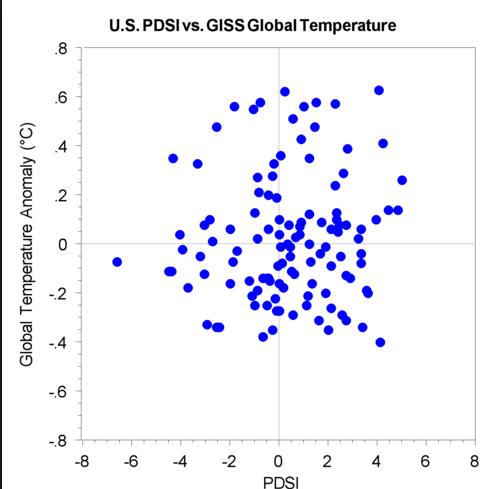
What type of association does this scatterplot show?
9
Dropdown

What type of association does this scatterplot show?
10
Dropdown

This scatterplot shows a
association.
11
Multiple Choice

Which graph shows a line of best fit for the scatter plot?
12
Multiple Choice

What type of association does this scatter plot show?
13
Multiple Choice

What type of association does this graph have?
14
Multiple Choice
What type of association does this graph have?
15
Multiple Choice
What type of association does this scatter plot represent?
16
Multiple Choice
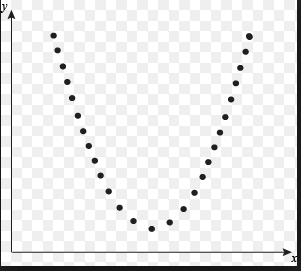
What type of association does this scatter plot represent?
17
Multiple Choice

How would you describe the association?
Show answer
Auto Play
Slide 1 / 17
SLIDE
