
Describing Data Distributions
Presentation
•
Mathematics
•
6th Grade
•
Medium
•
CCSS
6.NS.B.3
Standards-aligned

Kennedie Meadows
Used 49+ times
FREE Resource
5 Slides • 15 Questions
1
2

3


4

5
Multiple Choice
6
Multiple Choice
7
8
Multiple Choice

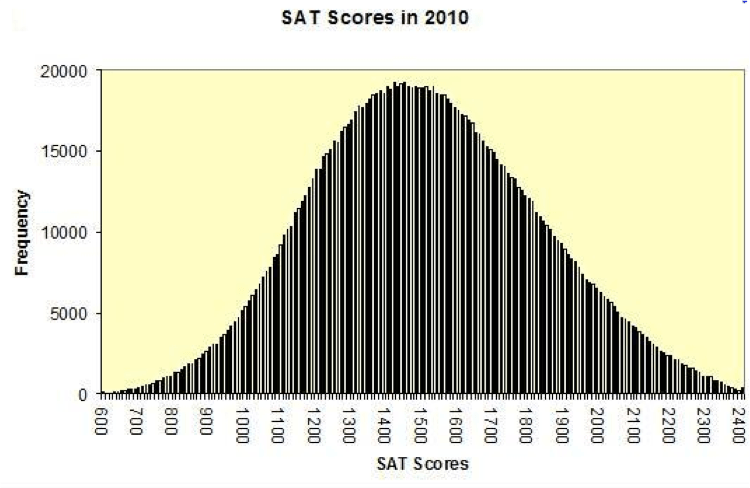
What number is the peak?
9
Multiple Choice
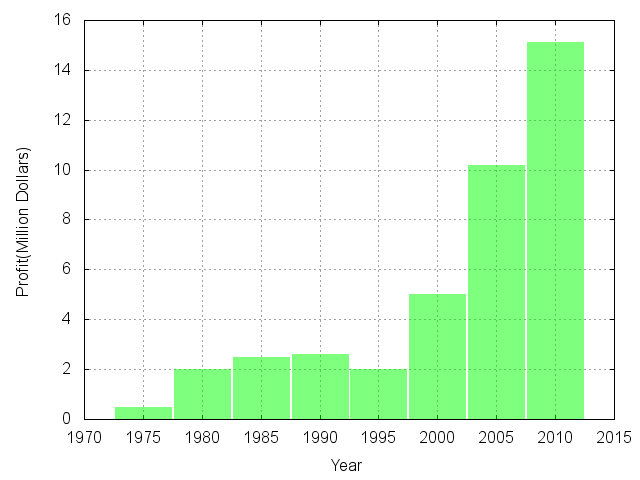
What is the shape of this bar graph?
10
Multiple Choice

11
Multiple Choice

What type of distribution is given?
12
Multiple Choice

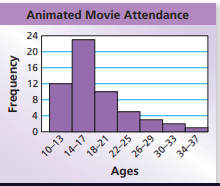
Describe the shape of the distribution.
13
Multiple Choice

Describe the shape of the distribution.
14
Multiple Choice

Describe the shape of the distribution.
15
Multiple Choice
16
Multiple Choice

10.)Which of the following best describes the shape of the distribution?
17
Multiple Choice
8.)What is the shape of the distribution?
18
Multiple Choice
5.)Which of the following best describes the shape of the distribution?
19
Multiple Choice
What is the shape of the data?
20
Multiple Choice
Show answer
Auto Play
Slide 1 / 20
SLIDE
