Search Header Logo
Guided Bell work 10/28/2024

Guided Bell work 10/28/2024

Assessment

Presentation

Mathematics

9th - 12th Grade

Practice Problem

Medium

CCSS
HSA.APR.A.1, 6.NS.B.3, HSF.IF.A.1

+5

Standards-aligned

Created by

Melinda Austin

Used 6+ times

FREE Resource

1 Slide • 14 Questions

1

2

Multiple Choice

Which point(s) does lie on the graph y=54x2y=-\frac{5}{4}x-2 ?

1

(-4, 3)

2

(0, 2)

3

(4, -1)

4

(-8, 4)

3

Math Response

Find the perimeter of the rectangle.

Use the formula: P=2(l)+2(w)P=2\left(l\right)+2\left(w\right)

Type answer here
Deg°
Rad

4

Math Response

Find the area of the larger rectangle.

Use the formula: A=lwA=l\cdot w

Type answer here
Deg°
Rad

5

Math Response

Find the area of the smaller rectangle.

Use the formula: A=lwA=l\cdot w

Type answer here
Deg°
Rad

6

Poll

When finding the area of a shaded image, the problem would be set up as the area of the larger image in parenthesis minus the area of the smaller image in parenthesis.

True

False

Not enough information

7

Drag and Drop

Question image
The area of the shaded image would be ​
Drag these tiles and drop them in the correct blank above

8

Math Response

Simplify: 27a5b3c179a11b8c9\frac{27a^5b^3c^{17}}{-9a^{11}b^8c^9}

Type answer here
Deg°
Rad

9

Multiple Choice

Simplify:

(4a9b3)2+15a18b6\left(-4a^9b^3\right)^2+15a^{18}b^6

1

a18b6-a^{18}b^6

2

7a18b67a^{18}b^6

3

7a18b6-7a^{18}b^6

4

31a18b631a^{18}b^6

10

Dropdown

Question image
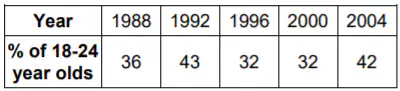
Use the data and write a line of best fit from the data in the table.

Line of best fit equation:​


Find the percent of people aged 18-24 projected to vote in the 2024 election.​

11

Math Response

Write an equation of the line that passes through (7, -5) and (-4, -5).

(Hint: determine the slope and picture what it would look like graphed.)

Type answer here
Deg°
Rad

12

Poll

If there is a positive linear association, can one variable be increasing and the other variable be decreasing?

Yes

No

Not enough information

13

Multiple Choice

Question image

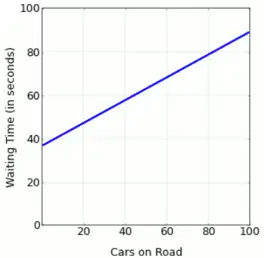
Which of the following statements correctly explains the relationship of the two variables in the graph.

1

There is a negative linear association between cars on the road and waiting time. As cars on the road increases, the waiting time increases.

2

There is a negative linear association between cars on the road and waiting time. As cars on the road increases, the waiting time decreases.

3

There is a positive linear association between cars on the road and waiting time. As cars on the road increases, the waiting time decreases.

4

There is a positive linear association between cars on the road and waiting time. As cars on the road increases, the waiting time increases.

14

Multiple Choice

Question image

According to the graph, which statement describes the slope.

1

For every 5 seconds, Tracy can travel 10 meters.

2

For every 2 seconds, Tracy can travel 4 meters.

3

For every 4 seconds, Tracy can travel 2 meters.

4

For every 8 seconds, Tracy can travel 1 meter.

15

Match

Match the following based on the scenario given.

A candlestick burns at a rate of 0.2 inches per hour. After 8 straight hours of burning, the candlestick is 13.4 inches tall. Write and solve a linear eequation to find the original height of the candle.

b =

m =

after 8 hours of burning the candle has lost how many inches?

y =

15

-0.2

1.6

13.4

Show answer

Auto Play

Slide 1 / 15

SLIDE