
Correlation Coefficient
Presentation
•
Mathematics
•
9th Grade
•
Practice Problem
•
Medium
+4
Standards-aligned

Sean Tarter
Used 9+ times
FREE Resource
12 Slides • 32 Questions
1

2

3
4
Multiple Choice
5
Multiple Choice
6

7

8
9
Multiple Choice
10
Multiple Choice
11
Multiple Choice
12
Multiple Choice
13
Multiple Choice
14
Multiple Choice
15

16
Multiple Choice

17
Multiple Choice
18
Multiple Choice
19
Multiple Choice

20
Multiple Choice
21
Multiple Choice

Which scatter plot shows a linear relationship between x and y?
22

23

24
25
Multiple Choice
26
Multiple Choice
27
Multiple Choice
28
Multiple Choice
29
Multiple Choice

30
Multiple Choice
31
Match
32
Multiple Choice
33
Multiple Choice
34
Multiple Choice
35
Multiple Choice
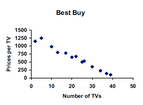
Estimate the correlation coefficient for this scatterplot.
36
Multiple Choice
37

38
Multiple Choice

Is this line an accurate line estimate of best fit for the data?
39
Multiple Choice

Which of the following lines represents the line of best fit for the scatter plot?
40
Multiple Choice

Which of the following lines represents the line of best fit for the scatter plot?
41
Multiple Choice

Which of the following lines represents the line of best fit for the scatter plot?
42
Multiple Choice

Select the statement that best describes the line.
43

44
Multiple Choice

What are the coordinates of the outlier?
Show answer
Auto Play
Slide 1 / 44
SLIDE
