Search Header Logo
8.15.2-Develop Understanding of Linear Functions

8.15.2-Develop Understanding of Linear Functions

Assessment

Presentation

Mathematics

6th - 8th Grade

Easy

CCSS
HSA.REI.D.10, HSF.IF.B.4, HSF.IF.C.7

+5

Standards-aligned

Created by

Jessica Freeman

Used 1+ times

FREE Resource

10 Slides • 21 Questions

1

media

2

media

3

Multiple Choice

What letter represents the slope in the equation y = mx + b ?
1
x
2
y
3
m
4
b

4

Multiple Choice

In the following equation, what is the y-intercept?  
y = -3x + 7
1
-3
2
7
3
-3/7
4
3

5

Multiple Choice

What is the slope in the equation:  y=4x+3
1
3
2
4x
3
4
4
x

6

Multiple Choice

If m=3 and b=6, what is the correct slope intercept equation?
1
y=3-6
2
y=3x-6
3
y=3x+6
4
y=6x+3

7

Multiple Choice

Question image
Find the slope.
1
3/2
2
-3/2
3
(-0,-3)
4
none of the above

8

Multiple Choice

Question image
What type of slope does the following graph have?
1
Postive
2
Negative
3
Zero Slope
4
Undefined

9

Multiple Choice

Question image
Which equation represents the following graph?
1
y = 3x + 2
2
y = -2x + 3
3
y = 2x + 3
4
y = -3x + 2

10

Multiple Choice

Question image

Find the slope from the table.

1

0.25

2

- 0.25

3

- 4

4

4

11

Multiple Choice

Question image
Find the slope of the line.
1
Undefined
2
0
3
1
4
-1

12

Multiple Choice

Question image
Find the slope of the line.
1
Undefined
2
0
3
1
4
-1

13

Multiple Choice

Question image
What is the slope?
1
1/2
2
2
3
7
4
3

14

media

15

media

16

media

17

media

18

media

19

Multiple Choice

Question image

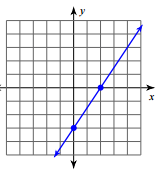
Is this function represented by the graph Linear or Nonlinear

1

linear

2

nonlinear

20

Multiple Choice

Question image

Is the function represented by the equation linear or nonlinear?

1

linear

2

nonlinear

21

Multiple Choice

Question image

Is the function represented by the equation linear or nonlinear?

1

linear

2

nonlinear

22

Multiple Choice

Question image

Is the function represented by the graph linear or nonlinear

1

linear

2

nonlinear

23

Multiple Choice

Question image
Which answer choice is true?
1
The table represents a linear function because there is a pattern for the x-coordinates and y-coordinates.
2
The table represents a linear function because the ratio of the change in the y value and the change in the x value is constant.
3
The table represents a nonlinear function because the ratio of the change in the y value and the change in the x value is not constant.
4
The table does not represent a function because there is more than one output for at least one input.

24

Multiple Choice

Which equation represents y as a linear function of x?

1

y=8x

2

x=5

3

y=4x2

4

y=x3

25

Multiple Choice

Question image

Which graph is linear?

1

A

2

B

3

C

4

D

26

Multiple Choice

Question image

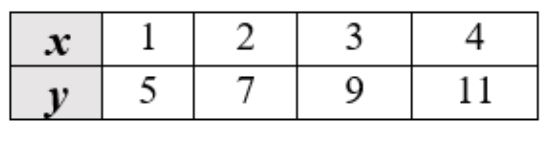
Is the function represented by the table linear or nonlinear?

1

Linear

2

Nonlinear

27

Multiple Choice

Is the function y=8x2y=\frac{8}{x^2}  linear or nonlinear?

1

Linear

2

Nonlinear

28

Multiple Choice

Question image
Is the graph pictured a linear or nonlinear function?
1
Linear
2
Nonlinear

29

media

30

media

31

media
media

Show answer

Auto Play

Slide 1 / 31

SLIDE