
Motion Graphing Lab
Presentation
•
Science
•
7th Grade
•
Easy
•
NGSS
MS-PS3-1
Standards-aligned

Kristina Ramirez
Used 7+ times
FREE Resource
13 Slides • 11 Questions
1

2
3
4
Multiple Choice

What is the total distance traveled on the graph?
5
Multiple Choice

Between which time interval did the object come to a stop?
6
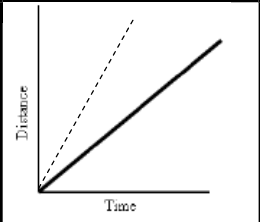
Poll

Which line is going the fastest?
7
8
9
10
11
12
13
14
15
Poll
16
17
Open Ended

Look at the graph. Write me a short story that goes with the distance time graph. Be creative!
18
19
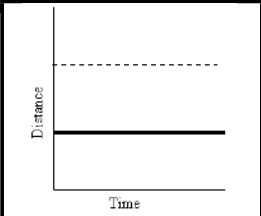
Multiple Choice

During which interval is the object not moving?
20
Multiple Choice

During which interval is the object moving back to its original position?
21
Multiple Choice

Which runner stopped for a rest?
22
Multiple Choice

Which runner won the race?
23
Multiple Choice
What does this graph represent?
24
Multiple Choice
What does this graph represent?
Show answer
Auto Play
Slide 1 / 24
SLIDE
