Histogram
Presentation
•
Mathematics
•
9th - 11th Grade
•
Hard

James Gonzalez
FREE Resource
9 Slides • 11 Questions
1
Histograms
Unit 6 - Statistics
Math I Honors
Mr. Johnson
2
Learning Objectives
Distinguish between histograms and bar charts
Interpret histograms and determine information from them
Assess histograms for shape, center, and spread
Develop a histogram using technology
3
Histograms are NOT Bar Charts!
Histograms can only be used to represent QUANTITATIVE data. Bar charts are only good for representing QUALITATIVE data.
4
Interpreting Histograms
ALWAYS look at the labels first!
Frequencies
"Bin" widths
Frequency Density: multiply by bin width
5
Multiple Choice
63
56
53
43
6
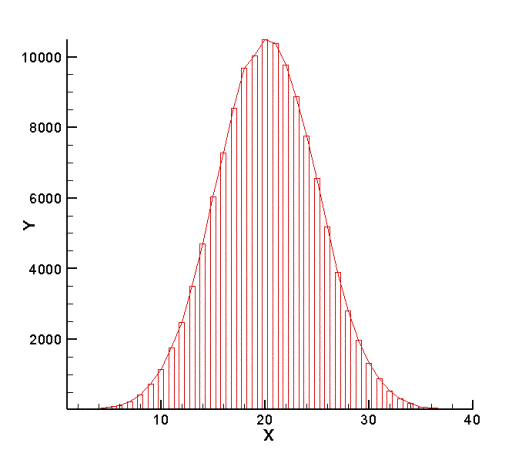
Shape of Histograms
Skew is easy to see in a histogram!
7
Multiple Choice
How would you describe this distribution?
Left skewed
Uniform
Right Skewed
Symmetrical
8
Multiple Choice
Describe the histogram:
Left Skewed
Normal/Symmetrical
Right Skewed
Uniform/Flat
9
Center of Histograms
Look for peak in your histogram!
Symmetric: peak corresponds to median AND mean
Skew: peak corresponds to median, less to mean
10
Multiple Choice
Which statement is true about the center of distribution?
The center is best described using the mean, because the distribution is skewed.
The center is best described using the median, because the distribution is skewed.
The center is best described by the mean and median, because the distribution is symmetric.
The center is best described by the outlier, because the distribution is symmetric.
11
Spread of Histograms
Range = max - min
Standard Deviation - COMPLEX formula, but technology can calculate it for us!
The higher the SD, the greater the spread
12
Multiple Choice
What is the range of ages shown in this histogram?
10 years
30 years
20 years
none of the above
13
Creating Histograms in Desmos
I will now demonstrate how to make histograms in Desmos. Afterward, we'll make a histogram from one of our class data sets and use it to answer questions.
14
Multiple Choice
Based on our class data histogram, what appears to be the approximate median hours of screen time?
0-2 hours
4-6 hours
6-8 hours
16-18 hours
15
Multiple Choice
Which best describes the shape of this histogram?
Left skewed
Symmetric
Right Skewed
16
Exit Ticket
Check your understanding of this lesson's concepts!
17
Multiple Choice
18
Multiple Choice
19
Multiple Choice
Which interval has 400 employees?
33-43
0-10
77-87
66-76
20
Dropdown
Histograms
Unit 6 - Statistics
Math I Honors
Mr. Johnson
Show answer
Auto Play
Slide 1 / 20
SLIDE

Similar Resources on Wayground
15 questions
Volume of a Cone/Sphere
Presentation
•
9th - 11th Grade
17 questions
Graphs of Exponential Functions
Presentation
•
9th - 11th Grade
17 questions
Adding and Subtracting Polynomials
Presentation
•
9th - 11th Grade
15 questions
Factoring Diamonds
Presentation
•
9th - 10th Grade
15 questions
Solving Systems of Equations Review
Presentation
•
9th - 12th Grade
16 questions
Asymptote Review
Presentation
•
9th - 12th Grade
14 questions
Rational Functions - x&y intercepts & vertical asymptotes
Presentation
•
9th - 12th Grade
16 questions
Compound Interest
Presentation
•
9th - 12th Grade
Popular Resources on Wayground
11 questions
Hallway & Bathroom Expectations
Quiz
•
6th - 8th Grade
10 questions
HCS SCI 03 Summer School Assessment 2
Quiz
•
3rd Grade
11 questions
Home Scope
Quiz
•
7th - 8th Grade
12 questions
2026 TAP Technology in the Classroom
Presentation
•
Professional Development
15 questions
HCS SCI 05 Summer School Assessment 2 Review
Quiz
•
5th Grade
15 questions
HCS SCI 04 Summer School Review 2
Quiz
•
4th Grade
59 questions
Geometry Unit 3 Review
Quiz
•
9th - 12th Grade
14 questions
FAST ELA READING SMAPLE TEST MATERIALS
Passage
•
3rd Grade