
Motion Graphs
Presentation
•
Physics
•
8th Grade
•
Practice Problem
•
Easy
•
NGSS
MS-PS3-1, HS-PS2-1
Standards-aligned

Jasmeet Anand
Used 42+ times
FREE Resource
10 Slides • 10 Questions
1

2

3
Multiple Choice
4

5

6

7

8

9

10

11

12
Multiple Choice
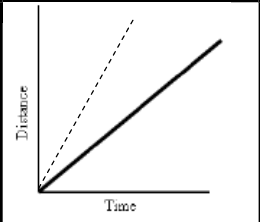
What does this graph represent?
13
Multiple Choice
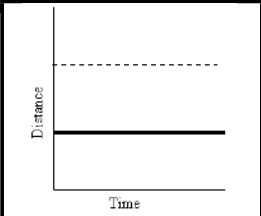
What does this graph represent?
14
Multiple Choice

What does this graph represent?
15
Multiple Choice
16
Multiple Choice

Why do the values on the graph form a straight line?
17
Multiple Choice

Describe the motion in the graph:
18
Multiple Choice
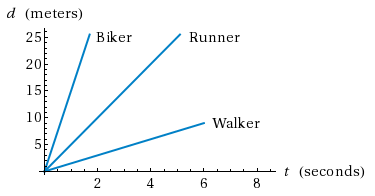
Which person moved the fastest in 3 seconds?
19
Multiple Choice

What is this graph showing?
20
Multiple Choice

Which graph shows an object not moving?
Show answer
Auto Play
Slide 1 / 20
SLIDE
