Search Header Logo
Scatter Plot Review

Scatter Plot Review

Assessment

Presentation

Mathematics

8th Grade

Hard

CCSS
HSF.LE.B.5, 8.EE.B.5, HSF.BF.A.2

+6

Standards-aligned

Created by

Sallymar Tomassini Lebron

Used 5+ times

FREE Resource

5 Slides • 19 Questions

1

media

2

media

3

media

4

Graphing

  1. Audrey surveyed eight people about how many magazine subscriptions they have and how many books they read in the last month. The table shows the results of Audrey’s survey. Construct a scatter plot to represent the data.

5

Interpret the Slope and y-intercept

media

1) What does the rate of change, or slope, represent in this situation?

describes the number of smoothies purchased for each 1 degree of temperature increase.


2) What does the y-intercept of the line represent in this situation?
The y-intercept represents the number of smoothies sold when the temperature is 0°F.


3) What equation relates the temperature, x, and the number of people who buy a smoothie, y?

Find the slope. Two points on the graph of the trend line are (40, 32) and (80, 56).

​​The scatter plot at the right suggests a linear relationship between the temperature and the number of smoothies purchased, in thousands.

6

Interpret the Slope and y-intercept

media

A smoothie café has the ingredients needed to make 50,000 smoothies on a day when the high temperature is expected to reach 90°F. Should the café employees expect to have enough ingredients for the day’s smoothie sales? Explain.

media

7

Multiple Choice

Question image
Which statement best describes the relationship shown in this scatter plot?
1
Students with a bigger shoe size earn a higher math score
2
Students with a smaller show size earn a higher math score
3
A student's shoe size has no effect on their math score
4
A student with a shoe size of 8 will always earn a score of 80%

8

Multiple Choice

Question image
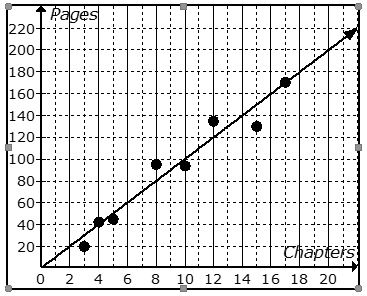
The scatter plot shows the relationship between the number of chapters and the total number of pages for several books.  Use the trend line to predict how many chapters would be in a book with 180 pages. 
1
12 chapters
2
15 chapters
3
18 chapters
4
21 chapters

9

Multiple Choice

Question image

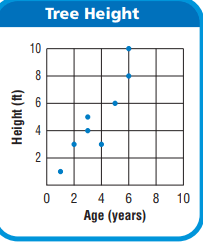
What is the age of the tree that is 8 feet tall?

1

6 Years

2

7 Years

3

8 Years

4

9 Years

10

Multiple Choice

Question image
The scatter plot below shows the number of books read by students in Mrs. Hall’s English class and their final grades. Which statement represents the best description about the line of best fit?
1
The more books students read, the lower their English grade.
2
The more books students read, the higher their English grade.
3
The fewer books students read, the higher their English grade. 
4
No relationship exists between the number of books students read and their English grades. 

11

Multiple Choice

Question image
Based on the scatterplot, what is the best prediction of the average number of hours a person spends at work every week, if that person spends an average of 10 hours on recreational activities every week?
1
33 hours
2
85 hours
3
50 hours
4
65 hours

12

Multiple Choice

Question image
Which scatter plot shows a linear relationship between x and y?
1
Graph A
2
Graph B
3
Graph C
4
Graph D

13

Multiple Choice

Question image
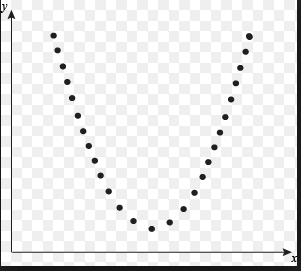
What type of association does this scatter plot represent?
1
positive linear association
2
negative association
3
no association
4
nonlinear association

14

Multiple Choice

The number of siblings you have and your weight. 
1
Positive correlation
2
Negative correlation
3
No correlation
4
All of the above

15

Multiple Choice

Question image
Which of the following lines represents the line of best fit for the scatter plot?
1
A
2
B
3
C
4
D

16

Multiple Choice

Question image
Select the statement that best describes the line.
1
The line is the line of best fit.
2
The line is NOT a line of best fit because it does not pass through two points.
3
The line is NOT a line of best fit because it does not go through the middle of the data set.
4
The line is NOT a line of best fit because it does not go through the origin.

17

Multiple Choice

Question image

Which of the following would be the most accurate equation for the scatter plot?

1

y = -2x - 7

2

y = -x + 7

3

y = 3x + 7

4

y = 25x + 7

18

Multiple Choice

Question image

Use the line of fit to predict how many coats would be sold on a day when the temperature was 40°F.

1

48

2

49

3

55

4

60

19

Multiple Choice

Question image

Use the trend line to predict the amount of average emails sent by a 60 year old.

1

4

2

7

3

10

4

11

20

Multiple Choice

Question image

Which of the following would be the most accurate equation for the scatter plot?

1

y = -2x - 7

2

y = -x + 7

3

y = 3x + 7

4

y = 25x + 7

21

Multiple Choice

Question image

A scatterplot is shown. Which equation best models the data in the scatterplot?

1

y = x + 50

2

y = x + 60

3

y = 5x + 50

4

y = 5x + 60

22

Multiple Choice

The relationship between the number of dollars per month that a company spends on advertising and its monthly sales can be modeled by the equation y = 0.1x + 10,000, where x is the amount spent on advertising and y is the monthly sales. According to the model, what will be the company's monthly sales if it spends no money on advertising?

1

$0

2

$1,000

3

$10,000

4

$100,000

23

Multiple Choice

The relationship between the time since Captain Summers became a ship captain and his total number of hours at sea can be modeled by the equation y = 800x + 2,200, where x is the time since he became a ship captain in years and y is his total number of hours at sea. How many hours at sea did Captain Summers have when he first became a ship captain?

1

A. 800

2

B. 1,400

3

C. 2,200

4

D. 3,000

24

Multiple Choice

The relationship between a person's age and the monthly cost to cover that person with a certain life insurance policy can be modeled by the equation y = 0.5x + 10, where x is the person's age and y is the monthly cost in dollars. Which of these statements is true according to the model?

1

A. It costs $20 a month to cover a 40-year-old.

2

B. It costs $30 a month to cover a 40-year-old.

3

C. It costs $40 a month to cover a 20-year-old.

4

D. It costs $40 a month to cover a 30-year-old.

media

Show answer

Auto Play

Slide 1 / 24

SLIDE