
7.SP.B.3 Assessing visual overlap of 2 data distributions
Presentation
•
Mathematics
•
6th - 8th Grade
•
Medium
+10
Standards-aligned

Victor Castillo
Used 1+ times
FREE Resource
9 Slides • 34 Questions
1
2

3
4

5

6

7
Multiple Choice

8
Multiple Choice

9
Multiple Choice
10
Multiple Choice

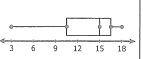
Describe the shape of the distribution.
11
Multiple Choice

Describe the shape of the distribution.
12
Match
13
Multiple Select
14
Multiple Choice
15
Multiple Choice
16
Multiple Choice
17
Multiple Choice
18
Multiple Choice
19
Multiple Choice
20
Multiple Choice
21
Multiple Choice
22
Multiple Choice
23
Multiple Choice
24
Multiple Choice

What is the mean?
25
Multiple Choice
What is the median?
26
Multiple Choice
What is the mode?
27
Multiple Choice
What is the range?
28
Multiple Choice
29
Multiple Choice

Which of the following describes the visual overlap of the two data sets?
30
Multiple Choice

Which measure might be misleading in describing the average price of sunglasses?
31
Multiple Choice

The dot plots show the heights of seventh graders in two classes. Which statement is best supported by these data?
32
33
Multiple Choice

The dot plots show the number of pets students have in two classes. Which statement is best supported by the data?
34
35
Multiple Choice

The dot plots show the grades on a test of two different classes. Which statement is best supported by the data?
36
37
Multiple Choice

The dot plots show the prices for different baits at two different shops. Which statement is best supported by the data?
38
Multiple Choice

The dot plots show the number of video games owned by both boys and girls. Which statement is best supported by the data?
39
Multiple Choice

Here are three statements about the height of students in two classes.
I. The median of the two classes is equal
II. The distribution of heights for Mr. Carter's class appears to be symmetrical
III. The mode of Mrs. Petunia's class is less than the mode of Mr. Carter's class
Which of these 3 statements appear to be true?
40
Multiple Choice

Here are three statements about the number of pets per household in two different classes.
I. The range of pets in Mrs. Jones' class is less than the range of pets in Mr. Carson's class
II. The mode of pets in Mrs. Jones' class is greater than the mode of pets in Mr. Carson's class
III. The median of pets is equal in both classes
Which of these statements appear to be true?
41
Multiple Choice

Here are three statements about the grades scored on a test in two different classes.
I. The distribution in both classes is not symmetrical
II. The mean in Ms. Henry's class is less than the mean in Mrs. Clarence's class.
III. The range in Ms. Henry's class is greater than the range in Mrs. Clarence's class
Which of these three statements appear to be true?
42
Multiple Choice

Here are some statements about the price of bait at two different stores.
I. The mode of the two stores is equal
II. The mean of Bait and Tackle is slightly higher than the mean of Grey's Baits
III. The median of both stores is equal
Which of these three statements appear to be true?
43
Multiple Choice

Here are three statements about the number of video games owned by Boys and Girls.
I. The range of video games owned by both Boys and Girls is equal
II. The median of video games Boys own is higher than the median of video games Girls own
III. The distribution of video games owned by girls is symmetrical
Which of the three statements appear to be true?
Show answer
Auto Play
Slide 1 / 43
SLIDE
Similar Resources on Wayground

40 questions
Transformations, Congruence, and Similarity
Lesson
•
6th - 8th Grade
35 questions
Solving Equations Introduction
Lesson
•
6th - 7th Grade
37 questions
Unit 3 Part 1 Retake Lesson and problems
Lesson
•
6th - 8th Grade
37 questions
Kitchen Equipment 1
Lesson
•
6th - 8th Grade
39 questions
Identifying Slope and Y-Intercept
Lesson
•
7th - 8th Grade
37 questions
Integer Operations
Lesson
•
6th - 9th Grade
39 questions
Scientific Notation and Standard Form
Lesson
•
6th - 8th Grade
36 questions
Surface Area and Volume Study Guide
Lesson
•
7th Grade
Popular Resources on Wayground
15 questions
Fractions on a Number Line
Quiz
•
3rd Grade
20 questions
Equivalent Fractions
Quiz
•
3rd Grade
25 questions
Multiplication Facts
Quiz
•
5th Grade
29 questions
Alg. 1 Section 5.1 Coordinate Plane
Quiz
•
9th Grade
22 questions
fractions
Quiz
•
3rd Grade
11 questions
FOREST Effective communication
Lesson
•
KG
20 questions
Main Idea and Details
Quiz
•
5th Grade
20 questions
Context Clues
Quiz
•
6th Grade
Discover more resources for Mathematics
36 questions
6th Grade Math STAAR Review
Quiz
•
6th Grade
14 questions
Volume of rectangular prisms
Quiz
•
7th Grade
14 questions
finding slope from a graph
Quiz
•
8th Grade
20 questions
Graphing Inequalities on a Number Line
Quiz
•
6th - 9th Grade
23 questions
Solve and Graph Inequalities
Quiz
•
6th Grade
15 questions
Distributive Property & Review
Quiz
•
6th Grade
10 questions
Mean, Median, Mode, and Range
Quiz
•
7th Grade
17 questions
Area of a parallelogram
Quiz
•
6th Grade