
Math 1 Unit 6 Statistics Day 2
Presentation
•
Mathematics
•
7th - 9th Grade
•
Medium
+7
Standards-aligned
Darla Jones
Used 40+ times
FREE Resource
8 Slides • 40 Questions
1
Math 1 Unit 6 Day 2
by Darla Jones
2
Vocabulary
Standard Deviation- average distance from the center
Shape- skew left, skew right, normal (bell, uniform, symmetric)
Center- mean, median, mode
Spread- IQR, range, standard deviation
3
4
With Desmos!
Enter data- A=[2,3,4,5,6,7,4,5,3,6,7,2,8,9] (must use a letter (not e or x), =, and [ ])
Go to next empty cell
Click Desmos keyboard
Click Functions
Scroll to Statistics
Click stdev and enter your capital letter in the parentheses (stdev (A))
5
Multiple Choice
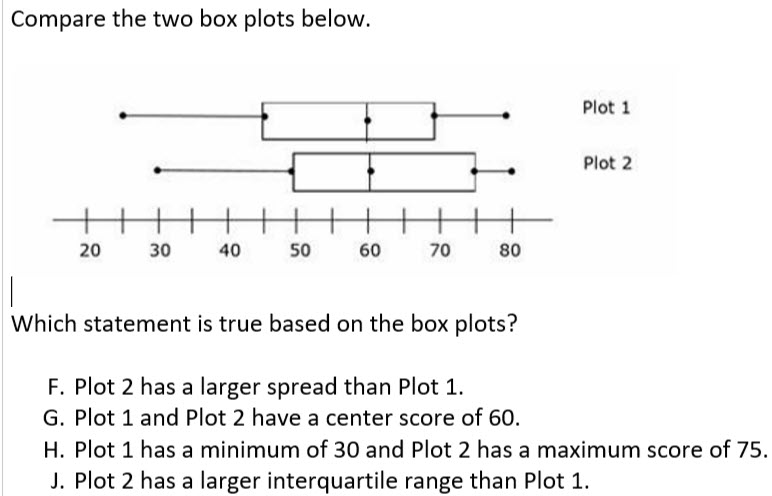
Which statement is true based on the box plots?
Plot 2 has a larger spread than plot 1.
Plot 1 and plot 2 have a center score of 60.
Plot 1 has a minimum of 30 and plot 2 has a maximum score of 75.
Plot 2 has a larger IQR than plot 1.
6
Multiple Choice
What does this symbol represent?
Standard Deviation
Variance
Mean Absolute Deviation
Sigma
7
Multiple Choice
What is the standard deviation for the data given:
{12, 13, 29, 18, 61, 35, 21}
293.67
15.87
17.14
41.98
8
Multiple Choice
List each set of data by color from the lowest standard deviation to the highest standard deviation.
blue, green, pink, red
red, pink, green, blue
pink, green, red, blue
blue, green, red, pink
9
Multiple Choice
Look at each data set's standard deviation.
Set 1: 15.9
Set 2: 14.64
Set 3: 17.88
Which set of data has values that are closer in relation to the mean value of the data?
Set 1
Set 2
Set 3
Not enough information is provided
10
Multiple Choice
What is the standard deviation for the data given:
5, 10, 7, 12, 0, 20, 15, 22, 8, 2
6.89
10.1
7.26
9
11
Multiple Choice
Set 1-Standard Deviation=3.1
Set 2-Standard Deviation=4.9
Set 3-Standard Deviation=1.7
Set 4-Standard Deviation=3.2
Which set of data probably has the points closest to the mean?
12
Multiple Choice
13
Shape of data: Normal
Most of the data is in the center of the graph
14
Shape of the data: Skewed Left
There is very little data on the left side of the graph
15
Shape of the data: Skewed Right
There is very little data on the right side of the graph
16
Multiple Choice
What is the shape of the graph?
Normal
Left Skew
Right Skew
17
Multiple Choice
What is the shape of the graph?
Normal
Left Skew
Right Skew
18
Multiple Choice
What is the shape of the graph?
Normal
Left Skew
Right Skew
19
20
Multiple Choice
21
Multiple Choice
22
Multiple Choice
23
Multiple Choice
1, 1, 1, 1, 1, 1, 1, 1, 1, 21
24
Multiple Choice
the range
average
constant
25
Multiple Choice
26
Multiple Choice
If a number that is close to the mean value is added to the set , how does this affect standard deviation?
27
Multiple Choice
If a number that is in the middle of the data is added to the set , how does this affect the range?
28
Multiple Choice
29
Multiple Choice
30
Multiple Choice
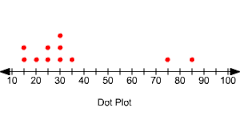
What is the shape of the data shown?
Skewed left
Skewed Right
Symmetric
Bell shaped
31
Multiple Choice
32
Multiple Choice
33
Multiple Choice
The dot plots show the gas mileage, in miles per gallon, for several cars and SUV's. Which type of vehicle has a larger spread?
cars
SUVs
34
Multiple Choice
An indication of a data display that shows where the data is at its highest point is a...?
cluster
gap
peak
outlier
35
Multiple Choice
3, 4, 8, 12, 7, 5, 4, 12, 3, 9, 11, 4, 14, 8, 2, 10, 3, 10, 9, 7
What is the Interquartile Range.
36
Multiple Choice
37
Multiple Choice
2- The second quartile (Q 2) is the median of the whole set .
3- The third quartile (Q 3) is the median of the upper half of the set.
38
Multiple Choice
39
Multiple Choice
Given the data: 21, 31, 26, 24, 28, 26 This is a 2 part question:
Part-1: What is the mean of the data?
40
Multiple Choice
Given the data: {21, 31, 26, 24, 28, 26} This is a 2 part question:
Part-2: Find the standard deviation of the data
S.D. ≈ 3.4
41
Multiple Choice
42
Multiple Select
Which distribution has a GREATER measure of center?
A
B
43
Multiple Select
Which distribution has a GREATER measure of variability?
A
B
44
Multiple Choice
The box-and-whisker plots below show the scores earned by 6th and 7th graders on a year-end reading test.
Which statement is best supported by the box-and-whisker plots?
The range of the 7th grade scores is greater than the range of the 6th grade scores.
The median of the 6th grade scores is greater than the median of the 7th grade scores.
The mean of the 7th grade scores is less than the mean of the 6th grade scores.
The number of 6th graders who took the test is greater than the number of 7th graders who took the test.
45
Multiple Select
The box and whisker plots below, illustrate the scores earned by 2 biology classes on a recent test.
Select all statements that are supported by the plots above.
The range of the 3rd period scores is less than the range of the 5th period scores.
The median of the 5th period scores is greater than the median of the 3rd period scores.
The number of students who took the test is larger in the 5th period class than in the 3rd period class.
The interquartile range is the same for both classes.
The 3rd period class has a higher median but has a lower range than the 5th period class.
46
Multiple Choice
Given the following distributions, which has the highest median?
Red
Purple
Black
47
Multiple Choice
Given the following distributions, which is symmetric?
Red
Purple
Black
48
Multiple Choice
What conclusion can you draw about how much time seventh and eighth graders spend reading each week?
All seventh graders read more than eighth graders.
On average, seventh graders read more than eighth graders.
The people who read the most are all in eighth grade.
There is not enough information in a box plot to draw any conclusions.
Math 1 Unit 6 Day 2
by Darla Jones
Show answer
Auto Play
Slide 1 / 48
SLIDE
Similar Resources on Wayground
45 questions
MTHS101 - Data Management
Presentation
•
8th - 10th Grade
42 questions
theoretical probability
Presentation
•
7th - 9th Grade
40 questions
Polynomial Terminology- 8th Grade Introduction
Presentation
•
8th - 9th Grade
41 questions
Module 1:Linear Inequalities in Two Variables
Presentation
•
8th Grade
43 questions
NUMBER OF SOLUTIONS FOR EQUATIONS LESSON
Presentation
•
8th Grade
44 questions
Chapter 2: Graphing & Writing Linear Equations
Presentation
•
8th - 9th Grade
45 questions
Chapter 4 Review: Linear Functions
Presentation
•
7th - 9th Grade
40 questions
Simple and Compound interest Review (Who dun it)
Presentation
•
7th - 8th Grade
Popular Resources on Wayground
19 questions
Naming Polygons
Quiz
•
3rd Grade
10 questions
Prime Factorization
Quiz
•
6th Grade
20 questions
Math Review
Quiz
•
3rd Grade
15 questions
Fast food
Quiz
•
7th Grade
20 questions
Main Idea and Details
Quiz
•
5th Grade
20 questions
Context Clues
Quiz
•
6th Grade
20 questions
Inferences
Quiz
•
4th Grade
19 questions
Classifying Quadrilaterals
Quiz
•
3rd Grade
Discover more resources for Mathematics
48 questions
8TH GRADE MATH FAST REVIEW
Quiz
•
8th Grade
20 questions
summer trivia
Quiz
•
8th Grade
14 questions
Volume of rectangular prisms
Quiz
•
7th Grade
22 questions
Simple Probability
Quiz
•
7th Grade
21 questions
Math Review
Quiz
•
7th Grade
20 questions
Multi Step Equations with Variables on Both Sides
Quiz
•
8th Grade
44 questions
7th Math Review
Quiz
•
7th Grade
15 questions
Independent and Dependent Probability
Quiz
•
7th Grade