Search Header Logo
  1. Resource Library
  2. Math
  3. Percents, Ratios, And Rates
  4. ...
  5. Graphing Equivalent Ratios
Graphing Equivalent Ratios

Graphing Equivalent Ratios

Assessment

Presentation

•

Mathematics

•

7th - 8th Grade

•

Hard

Created by

Joseph Anderson

FREE Resource

3 Slides • 18 Questions

1

Ratio Tables & Graphing Proportional Relationships

Objective: Describe how proportional relationships are represented using the coordinate plane

media

2

Multiple Choice

Question image

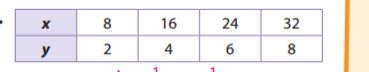
Is this table proportional or non-proportional?

1

Proportional

2

Non-Proportional

3

both

4

neither

3

Multiple Choice

Question image

Determine whether the ratios are equivalent.

1

yes

2

no

3

maybe

4

Multiple Choice

Mrs. Shelly paid $3 for 6 muffins and Mrs. Kloske paid $9 for 18 muffins.


Do these relationships form equivalent ratios?

1

yes, equivalent

2

no, not equivalent

5

Multiple Choice

Question image
If Kevin is mixing 35 oz of yellow paint, he will need how many oz of red?
1
21 oz
2
24 oz
3
33 oz
4
18 oz

6

Multiple Choice

Question image
Which table shows a proportional relationship?
1
A
2
B
3
C
4
D

7

Multiple Choice

Question image

How many tbsp of honey is needed for 20 cups of flour?

1

2

2

18

3

25

4

16

8

Multiple Choice

Question image
Which graph is non-proportional?
1
A
2
B
3
C
4
D

9

Multiple Choice

Question image

Four customers at a gas station this morning each purchased the same type of gasoline. The table shows the amounts of gasoline they purchased and the costs.


Using the data in the table above, how much does 1 gallon of gas cost?

1

$3.50

2

$4.00

3

$4.50

4

$5.00

10

Open Ended

Question image

What do you notice about the graph?


(Click on the graph to enlarge the image.)

11

Properties of Proportional Graphs

  • All graphs of proportional relationships are represented with a straight line to show a constant rate also known as LINEAR.

  • All proportional relationships pass through the origin.

  • Can be used to calculate the unit rate or constant of proportionality.

media

12

Multiple Choice

Question image

The graph represents the number of laps a car drove around a track compared to the number of minutes.


How many laps did the car do in 6 minutes?


(Click the graph to enlarge the image.)

1

2 laps

2

6 laps

3

4 laps

4

9 laps

13

Calculating Unit Rate from a Proportional Graph

We can use individual points on the line to calculate the unit rate...


In a UNIT RATE, one of the values is ONE!
EX: a RATE is 400 miles in 5 Hours— the UNIT rate would be 80 miles PER hour or 80 miles for every ONE hour!

We divided the 400 miles by the 5 hours and got 80 miles for every one hour.

media

14

Multiple Choice

Question image

What is the unit rate in miles per hour for this proportional relationship?


(Click the graph to enlarge the image.)

1

60 miles per hour

2

120 miles per 2 hours

3

1 mile per hour

4

60 miles per 2 hours

15

Multiple Choice

Question image

What is the constant of proportionality (unit rate) of the speed of the sloth based on the graph?


(Click the graph to enlarge the image.)

1

1 minute per 6 feet

2

6 feet per minute

3

1 minute per 3 feet

4

3 feet per minute

16

Multiple Choice

Question image

The graph above shows the price of games in dollars. Is the graph proportional and how do you know?


(Click the graph to enlarge the picture.)

1

The graph is proportional because it is a straight line.

2

The graph is proportional because it is a straight line that passes through the origin.

3

The graph is not proportional because it does not pass through the origin.

4

The graph is not proportional because it is not a straight line and it does not pass through the origin.

17

Multiple Choice

Question image

The graph represents the number of words Taylor can type over a certain number of minutes. Which of the following statements is true?


(Click the graph to enlarge the image.)

1

Taylor can write 6 words per minute

2

Taylor can write 25 words per minute

3

Taylor can write 50 words per minute

4

Taylor can write 150 words per minute

18

Multiple Choice

Question image

The following graph is not proportional, why is that?


(Click the graph to enlarge the image.)

1

We don't know what number it starts at.

2

It does not pass through the origin.

3

But it IS proportional!

19

Multiple Choice

You travel 150 miles on 5 gallons. What is the unit rate in miles per gallon?

1

15 miles per gallon

2

30 miles per gallon

3

3 miles per gallon

4

25 miles per gallon

20

Multiple Choice

Question image

What is the unit rate for the rain fall?


(Click on the graph to enlarge the image.)

1

2 cm per hour

2

1 cm per hour

3

1/2 cm per hour

4

4 cm per hour

21

Multiple Choice

What makes a graph between two quantities proportional?

1

It makes a straight line.

2

The line goes through (0,0)

3

It makes a curved line.

4

It makes a straight line and passes through (0,0).

Ratio Tables & Graphing Proportional Relationships

Objective: Describe how proportional relationships are represented using the coordinate plane

media

Show answer

Auto Play

Slide 1 / 21

SLIDE