
Interpret Regression Lines
Presentation
•
Mathematics
•
8th - 9th Grade
•
Hard

Joseph Anderson
FREE Resource
23 Slides • 13 Questions
1
2

3

4

5
Draw
6

7

8

9
Open Ended

What do you remember about Linear Regression?
10

11

12

13

14

15

16
Draw
17

18
Multiple Choice

Does this graph have a positive, negative, or no relationship correlation?
19
Multiple Choice

20
Multiple Choice

What type of correlation does this graph show?
21

22

23

24

25
Fill in the Blank
26
Multiple Choice
27

28
29

30

31
Multiple Choice
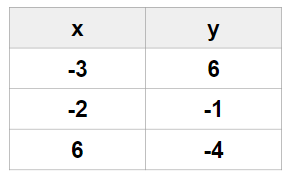
Write the linear regression equation for the following data points. Round to the nearest hundredth.
32
Multiple Choice

33
Multiple Choice

34
Open Ended

How well did you understand today's lesson? One of your classmates is absent today. Write down one item that they should know based upon today’s lesson.
35

36
Multiple Choice

Which relationship is shown by this scatter plot?
Show answer
Auto Play
Slide 1 / 36
SLIDE
Similar Resources on Wayground

28 questions
8.5. Lesson 7- Compare Linear Functions
Lesson
•
8th Grade
27 questions
Box and Whisker Plots
Lesson
•
7th - 9th Grade
29 questions
Factoring Review
Lesson
•
9th Grade
31 questions
DEPENDENT AND INDEPENDENT EVENTS
Lesson
•
7th - 9th Grade
30 questions
Solving Quadratics by Square Roots
Lesson
•
9th - 10th Grade
30 questions
Topic 1 - equations & inequal. review
Lesson
•
9th Grade
33 questions
Introduction to Functions
Lesson
•
8th - 9th Grade
30 questions
Combine Like Terms Introduction
Lesson
•
7th - 9th Grade
Popular Resources on Wayground
15 questions
Fractions on a Number Line
Quiz
•
3rd Grade
10 questions
Probability Practice
Quiz
•
4th Grade
15 questions
Probability on Number LIne
Quiz
•
4th Grade
20 questions
Equivalent Fractions
Quiz
•
3rd Grade
25 questions
Multiplication Facts
Quiz
•
5th Grade
22 questions
fractions
Quiz
•
3rd Grade
6 questions
Appropriate Chromebook Usage
Lesson
•
7th Grade
10 questions
Greek Bases tele and phon
Quiz
•
6th - 8th Grade
Discover more resources for Mathematics
15 questions
Graphing Inequalities
Quiz
•
7th - 9th Grade
20 questions
Graphing Inequalities on a Number Line
Quiz
•
6th - 9th Grade
8 questions
8th U5L20 Volume of Sphere
Quiz
•
8th Grade
20 questions
Solving Systems of Equations Review
Quiz
•
8th Grade
20 questions
Slope from a Graph
Quiz
•
8th Grade
15 questions
Combine Like Terms and Distributive Property
Quiz
•
8th - 9th Grade
10 questions
Plotting Points on a Coordinate Plane: Quadrant 1 Essentials
Interactive video
•
6th - 10th Grade
20 questions
Scatter Plots and Line of Best Fit
Quiz
•
8th Grade