Search Header Logo
One Variable Statistics Review

One Variable Statistics Review

Assessment

Presentation

•

Mathematics

•

5th - 10th Grade

•

Hard

Created by

Joseph Anderson

FREE Resource

65 Slides • 14 Questions

1

One Variable Statistics - Algebra 1

dot plots, histograms, box-and-whisker plots

media

2

media

3

media

4

media

5

media

6

media

7

Multiple Choice

The median is
1
The middle score
2
 Scores added & divided by the number of scores
3
The most frequent score
4
The middle when in order

8

Multiple Choice

Question image
What is the MODE of this data?
1
90
2
85, 90, and 95
3
85 and 95
4
None

9

Multiple Choice

Question image
What is the range of the test scores?
1
15
2
100
3
6
4
10

10

Multiple Choice

Question image

What is the highest score in the class?

1

88%

2

100%

3

13

4

98%

11

media

12

media

13

media

14

media

15

media

16

media

17

media

18

media

19

media

20

media

21

media

22

media

23

media

24

media

25

Multiple Choice

Question image
How many cities have temperatures between 70 degrees and 99 degrees?
1
44
2
34
3
26
4
62

26

Multiple Choice

Question image
Which interval shows the greatest number of pets?
1
15-19
2
0-4
3
5-9
4
10-14

27

Multiple Choice

Question image

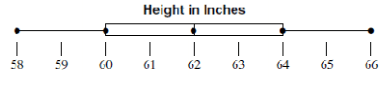
How many students were greater than or equal to 60 inches tall?

1

21

2

11

3

17

4

6

28

media

29

media

30

media

31

media

32

media

33

media

34

media

35

media

36

media

37

media

38

media

39

media

40

Multiple Choice

Question image

The frequency table shows the colors that fifth graders preferred for their field day shirts.


Based on the data in the table, how many students preferred blue and orange?

1

60

2

56

3

59

4

53

41

Multiple Choice

Question image

Which movie genre is liked best by all age groups?

1

Action

2

Comedy

3

Horror

4

Romance

42

media

43

media

44

media

45

media

46

media

47

media

48

media

49

media

50

media

51

media

52

media

53

media

54

media

55

media

56

media

57

media

58

media

59

media

60

media

61

media

62

media

63

media

64

media

65

media

66

media

67

media

68

media

69

media

70

media

71

media

72

media

73

media

74

Multiple Choice

Question image
Which restaurant has a higher median wait time?
1
Lucy's Steakhouse
2
Gary's Grill
3
They are the same

75

Multiple Choice

Question image
What is the interquartile range (IQR)?
1
4
2
64
3
60
4
8

76

Multiple Choice

Question image
What is the median?
1
62
2
58
3
66
4
60

77

Multiple Choice

Question image
What value is the lower quartile?
1
66
2
58
3
60
4
64

78

Multiple Choice

Question image

What is the minimum value?

1

64

2

58

3

66

4

60

79

Congratulations! You can now work with data representations!

One Variable Statistics - Algebra 1

dot plots, histograms, box-and-whisker plots

media

Show answer

Auto Play

Slide 1 / 79

SLIDE