Search Header Logo
  1. Resource Library
  2. Math
  3. Data And Graphing
  4. Dot Plot
  5. Math Dot Plot Lesson
Math Dot Plot Lesson

Math Dot Plot Lesson

Assessment

Presentation

•

Mathematics

•

3rd Grade

•

Hard

Created by

Joseph Anderson

FREE Resource

5 Slides • 11 Questions

1
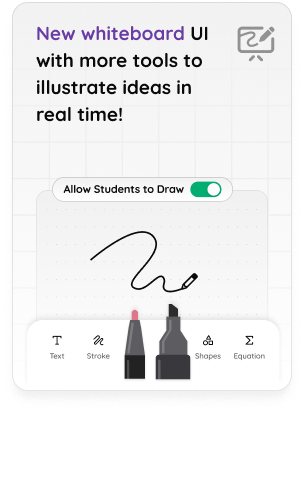
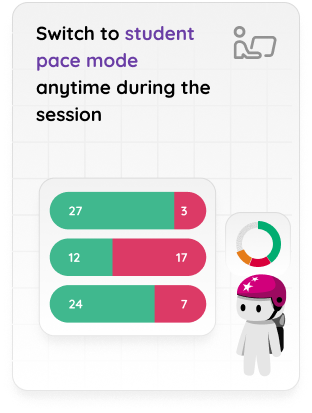
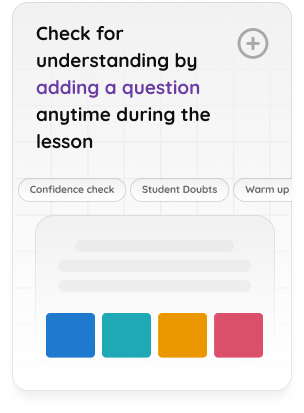
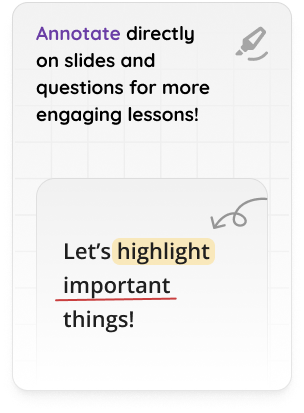
​Discover new features in Lessons!
Finish all phases of “I-do ; We-do ; You-do” with Quizizz

media
media
media
media

​You can also create lessons directly on Google Slides using “Quizizz Extension”.
Read more about it here

2

Data Representations
  • Information collected about people, events or objects

  • Categorical or Numerical

  • Ways to collect: Survey, interview, polls, spontaneous

  • Ways to record: Frequency table, dot plot, stem-leaf plot

3

  • Organized in rows and columns

  • One tally=one representation

  • Quick for tallying a large amount of info​

Frequency Tables

media

4

  • Uses titles, subtitles, and labels

  • One "dot" = one representation

  • Each "dot" can represent > 1

​

Dot Plot

media

5

Multiple Choice

Frequency tables use marks called _______ to represent each representation.

1

frequencies

2

frequently

3

tallies

4

totals

6

Fill in the Blanks

Dot plots use

to represent each representation.

7

Multiple Choice

Question image
1

3

2

2

3

4

4

1

8

Multiple Choice

Question image
1

1 1/2

2

1/2

3

3/4

4

2

9

Multiple Choice

Question image
1

A

2

B

3

C

4

D

10

Multiple Choice

Question image
1

A

2

B

3

C

4

D

11

Multiple Choice

Question image
How many cars were sold on Saturday and Sunday?
1
5
2
3
3
8
4
10

12

Multiple Choice

Question image
How many strings were measured in all?
1
12
2
11
3
7
4
2

13

Multiple Choice

Question image
How many pieces of fudge sold on Saturday were smaller than 2 pounds? 
1
7 pieces
2
10 pieces
3
20 pieces
4
10 

14

Multiple Choice

Question image
How many students had more than 6 candy bars?
1
5
2
2
3
3
4
1

15

Multiple Choice

Question image

What was the day with the least amount of cars sold?

1

Monday

2

Tuesday

3

Wednesday

4

Thursday

16

Remember

  • Each dot represents one representation unless otherwise stated

  • To find the total add the tallies/dots

  • Make sure that responses = tallies/dots (not more than one)

  • Label your axis' so that it is easy to graph and read

  • What do you want to know.....???

  • Questions?

pattern-tertiary

​Discover new features in Lessons!
Finish all phases of “I-do ; We-do ; You-do” with Quizizz

media
media
media
media

​You can also create lessons directly on Google Slides using “Quizizz Extension”.
Read more about it here

Show answer

Auto Play

Slide 1 / 16

SLIDE