
Equation for Line of Best Fit
Presentation
•
Mathematics
•
10th Grade
•
Hard
Joseph Anderson
FREE Resource
11 Slides • 16 Questions
1
Line of Best Fit Lesson
2

You can open this webpage in a new tab.
3
4
5
6
Multiple Choice
What is a scatter plot? #1
A scatter plot is a type of plot or mathematical diagram using Cartesian coordinates to display values for typically two variables for a set of data points.
A scatter plot is a type of plot that displays values for only one variable.
A scatter plot is a type of plot that uses polar coordinates instead of Cartesian coordinates.
A scatter plot is a type of plot that is used to display categorical data.
7
Multiple Choice
What is the purpose of a scatter plot? #2
To display the trend of a single variable over time.
To show the distribution of a single variable.
To compare the means of two groups.
To display the relationship between two variables.
8
Multiple Choice
What is the line of best fit? #4
A curved line that represents the best approximation of the relationship between two variables in a scatter plot.
A line that represents the average of all the data points in a scatter plot.
A straight line that represents the best approximation of the relationship between two variables in a scatter plot.
A line that connects all the data points in a scatter plot.
9
Multiple Choice
What does the slope of the line of best fit represent? #6
Y-intercept
Standard deviation
Rate of change
Intercept
10
Multiple Choice
How can you determine if a scatter plot has a positive correlation? #8
Check if the points on the plot generally decrease from left to right.
Check if the points on the plot are randomly scattered.
Check if the points on the plot form a straight horizontal line.
Check if the points on the plot generally increase from left to right.
11
12
Multiple Choice
Which sentence describes the relationship shown on this scatter plot? #11
13
Multiple Choice
The scatter plot shows the relationship between the number of chapters and the total number of pages for several books. Use the trend line to predict how many chapters would be in a book with 180 pages. #12
14
Multiple Choice
Which sentence describes the relationship shown on this scatterplot? #13
15
Multiple Choice
What type of association (correlation) does this graph have? #18
16
Multiple Choice
What type of association does this graph show? #20
17
Multiple Choice
What is the equation of the line of best fit? #22
y= 2x+3
y=3x+2
y= 21x +3
y= −21x +3
18
19
20

Correlation and regression line calculator that shows work
You can open this webpage in a new tab.
21
Multiple Choice
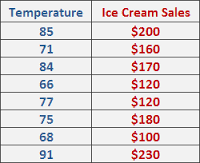
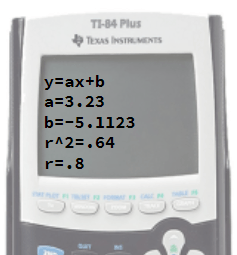
Find the equation of the line of best fit for the given data. #24
y = 163.41x+1.49
y =- 163.41x+ 4.19
y =- 4.19x+163.41
y = 4.19x -163.41
22
Multiple Choice
The linear model to represent the distance (in miles) traveled given the time (in hours) driving is
m=−1.79+61.93h . Predict how far a person will travel driving 10 hours. #25
617.51 miles
621.09 miles
100 miles
0.19 miles
23
24
25
Multiple Choice
Average fat intake per citizen of a country and average cancer rate of a country. r=.73 #30
strong positive
strong negative
weak positive
weak negative
26
Match
Match the following. #44
Non-linear Correlation
No Correlation
Positive, Linear Correlation
Negative, Linear Correlation
Non-linear Correlation
No Correlation
Positive, Linear Correlation
Negative, Linear Correlation
27
Multiple Choice
Write the equation for the linear regression shown. #46
y=−5.11x+3.23
r=0.8
y=3.23x − 5.11
y=0.64x+0.8
Line of Best Fit Lesson
Show answer
Auto Play
Slide 1 / 27
SLIDE
Similar Resources on Wayground
22 questions
Quadrilaterals
Presentation
•
10th Grade
22 questions
Rigid Transformations
Presentation
•
10th Grade
23 questions
Geometric Mean
Presentation
•
10th Grade
23 questions
3-3 Proving Lines Parallel
Presentation
•
10th Grade
20 questions
Box and Whiskers Plot
Presentation
•
9th - 10th Grade
22 questions
Geometry, Section 3-1: Parallel Lines and Transversals
Presentation
•
9th - 10th Grade
20 questions
Classifying and Naming Angles
Presentation
•
10th Grade
21 questions
Angle Pair Relationships
Presentation
•
10th Grade
Popular Resources on Wayground
20 questions
STAAR Review Quiz #3
Quiz
•
8th Grade
20 questions
Equivalent Fractions
Quiz
•
3rd Grade
6 questions
Marshmallow Farm Quiz
Quiz
•
2nd - 5th Grade
20 questions
Main Idea and Details
Quiz
•
5th Grade
20 questions
Context Clues
Quiz
•
6th Grade
20 questions
Inferences
Quiz
•
4th Grade
19 questions
Classifying Quadrilaterals
Quiz
•
3rd Grade
12 questions
What makes Nebraska's government unique?
Quiz
•
4th - 5th Grade
Discover more resources for Mathematics
16 questions
Circles - Equations, Central & Inscribed Angles
Quiz
•
9th - 12th Grade
10 questions
Calculating Surface Area of a Triangular Prism
Interactive video
•
6th - 10th Grade
20 questions
Central Angles and Arc Measures 2
Quiz
•
10th Grade
35 questions
Venn Diagrams, Theoretical, & Experimental Review
Quiz
•
9th - 12th Grade
15 questions
Calculate and Classify Arc Measures
Quiz
•
9th - 12th Grade
20 questions
April 1st 2026 Transformations of Rational Functions
Quiz
•
9th - 12th Grade
6 questions
Intro to Step Functions
Quiz
•
10th - 12th Grade
11 questions
Solving Quadratic Equations by Factoring
Quiz
•
9th - 12th Grade