Search Header Logo
Finding Outliers

Finding Outliers

Assessment

Presentation

•

Mathematics

•

6th - 8th Grade

•

Hard

Created by

Joseph Anderson

FREE Resource

6 Slides • 50 Questions

1

​Outliers

​Clusters

​An outlier is a data point in a scatter plot that does not follow the trend of the data.

A group of data points that are closely grouped together.​

media

​outlier

cluster

2

What is an outlier?

  • An outlier is a point on the graph that is outside of the range of data

  • You can think of it in terms of kids. The teacher gives everyone in class bonus points and cookies and everyone is happy except for one or two students. Those students would be the outlier(s)

3

Outlier

A data value that is much lower or much greater than all of the other values in a data set.

4

Outlier #1

Notice how the point at (30, 6000) is an outlier and does not fit with the data

media

5

Not an Outlier

This is NOT an Outlier because it falls on the TREND LINE or Line of BEST FIT.


Note: the line of best fit is a line that goes through the middle of the points

media

6

Multiple Choice

Question image

Identify the outlier for the given data?

23, 34, 27, 7, 30, 26, 28, 31, 34

1

7

2

23

3

31

4

34

7

Multiple Choice

Question image

Your math grades are 90, 85, 0, 90, 80, 100, and 90. Which grade is the outlier?

1

90

2

0

3

80

4

100

8

Multiple Choice

Question image

Identify the outlier for the given data?

23, 34, 27, 7, 30, 26, 28, 31, 34

1

7

2

23

3

31

4

34

9

Multiple Choice

Question image

What is the outlier in the following data?

11, 19, 17, 8, 37, 11, 19, 16, 22

1

22

2

8

3

37

4

22

10

Multiple Choice

Question image

Which of the following numbers is the outlier?

34, 75, 82, 95, 100, 100

1

75

2

34

3

95

4

100

11

Multiple Choice

Question image

Find the outlier(s) in the set of data

92, 88, 106, 196, 76, 72, 67, 10, 115, 73, 111, 59

1

196

2

10

3

none

4

10, 196

12

Multiple Choice

Question image

A bowler had the following scores: 196, 205, 197, 280 and 202. What is the difference between the mean with the outlier and the mean without the outlier?

1

13

2

16

3

19

4

22

13

Multiple Choice

Question image

Is the point in red an outlier?

1

Yes

2

No

14

Multiple Choice

Question image

Identify any outliers.

1

Outlier at x = 18

2

Outlier at x = 12

3

Outlier at x = 6

4

There aren't any outliers in this graph.

15

Poll

Can you find the outliers?

Yes! I've got this.

With a little practice, I'll have this mastered.

I's still a little foggy, but I got one right.

I don't understand this at all!

16

Multiple Choice

Review: What is an outlier?

1

Someone who lays outside

2

A piece of data that lies

3

A piece of data that is very different from the other data.

17

Multiple Choice

Question image

What are the coordinates of point H?

1

(-4, 2)

2

(4, -2)

3

(-2, 4)

4

(4, 4)

18

Multiple Choice

Question image

What is the ordered pair for point K?

1

(-3, -3)

2

(3, -3)

3

(-4, -4)

4

(5, 8)

19

Multiple Choice

Question image

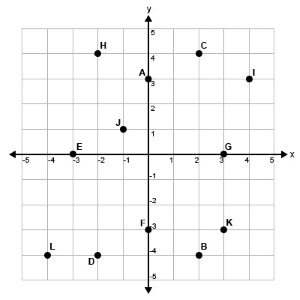
What is the ordered pair for point E?

1

(3, 0)

2

(0,4)

3

(0, -3)

4

(-3, 0)

20

Multiple Choice

Question image

On what axis would I expect to find point F?

1

y-axis

2

x-axis

21

Multiple Choice

Question image

What is the origin?

1

The point furthest away from the center of the coordinate plane

2

The four regions of a coordinate plane

3

the x-axis

4

Where the x-axis and y-axis intersect

22

Multiple Choice

Question image

Which axis would I find point A?

1

x-axis

2

y-axis

23

Multiple Choice

Question image

What is an ordered pair?

1

a set of numbers used to locate a point on the coordinate plane

2

the vertical number line

3

a number that corresponds to a number on the y-axis

4

a point where the numbers intersect

24

Multiple Choice

Question image

The vertical number line is called the __________?

1

x-coordinate

2

x-axis

3

y-axis

4

y-coordinate

25

Multiple Choice

Question image

The horizontal number line is called the _____________?

1

y-axis

2

y-coordinate

3

x-axis

4

x-coordinate

26

Multiple Choice

Question image

Coordinate points (-1, 1) would lead me to which plot point?

1

H

2

G

3

A

4

J

27

Multiple Choice

Question image

Ordered pair (3, 0) would lead me to which point?

1

G

2

E

3

F

4

A

28

Multiple Choice

Question image

In an ordered pair ( __ , __) which axis comes first?

1

y

2

x

29

Multiple Choice

Question image

Ordered pair (-4, -4) would lead you to which plot point?

1

H

2

L

3

I

4

K

30

Multiple Choice

Question image

What letter is ordered pair (-1,2)?

1

G

2

S

3

P

4

A

5

B

31

Multiple Choice

Question image

What letter is ordered pair (6,-2)?

1

M

2

S

3

P

4

A

5

B

32

Multiple Choice

Question image

What letter is ordered pair (-7,-5)?

1

M

2

S

3

P

4

A

5

B

33

Multiple Choice

Question image

What letter is ordered pair (5,4)?

1

M

2

S

3

P

4

A

5

B

34

Multiple Choice

Question image
What letter is at (7, -6)?
1
D
2
L
3
X
4
There is no letter at those coordinates.

35

Multiple Choice

Question image
What letter is at (1,-7 )
1
There is no letter at those coordinates.
2
B
3
C
4
K

36

Multiple Choice

Question image
What letter is at (-3,7)
1
There is no letter at those coordinates.
2
T
3
E
4
H

37

Multiple Choice

The x axis goes

1

left and right (horizontal)

2

up and down (vertical)

38

Multiple Choice

The y-axis goes _

1

left and right (horizontal)

2

up and down (vertical)

39

Multiple Choice

Another name for a graph is _

1

thing-a-ma-bob

2

coordinate plane

3

whatchamajiggit

40

Multiple Choice

A point on the coordinate plane is also called a _

1

Thing-a-ma-bob

2

whatchamajiggit

3

ordered pair

41

Multiple Choice

A value that is much higher or much lower than the other values in a set of data.
1
Outlier
2
Box Plot
3
Range
4
Histogram

42

Point A

What quadrant is it in and what is the ordered pair?

media

43

Multiple Choice

Question image

POINT A: What quadrant is it in and what is the ordered pair?

1

Quadrant 2 (5,1)

2

Quadrant 1 (-3,5)

3

Quadrant 2 (-3,5)

4

Quadrant 2 (5.-3)

44

Multiple Choice

Question image

POINT B: What quadrant is it in and what is the ordered pair?

1

Quadrant 2 (-4,-6)

2

Quadrant 3 (-6,-4)

3

Quadrant 4 (-6,-4)

4

Quadrant 3 (-6,-3)

45

Multiple Choice

Question image

POINT S: What quadrant is it in and what is the ordered pair?

1

Quadrant 2 (2,3)

2

Quadrant 1 (4,3)

3

Quadrant 1 (3,2)

4

Quadrant 2 (-2,-3)

46

Multiple Choice

Question image

POINT D: What quadrant is it in and what is the ordered pair?

1

Quadrant 4 (3,8)

2

Quadrant 1 (8,-3)

3

Quadrant 3 (-8,3)

4

Quadrant 4 (8,-3)

47

Multiple Choice

The coordinates of a point are (y, x)
1
True
2
False

48

Multiple Choice

Question image
What error did the student make when plotting the point (3, 4) according to the picture?                                                                                                                                                                                                                                                                                                                                                                         
1
The student moved left along the x-axis when he should have moved right
2
The student plotted the y-coordinate in place of the x-coordinate
3
The student didn't make a mistake
4
Both Options 1 and 2

49

Multiple Choice

If you were to plot the point (4, -12) what would be the correct method?
1
Up 4, left 12
2
Right 4, up 12
3
Down 4, left 12
4
Right 4, down 12

50

Multiple Choice

If you were to plot the point (-2, -6) what would be the correct method?
1
Down 2 , Left 6
2
Left 6, Down 2
3
Left 2, Down 6
4
Left 2, Up 6

51

Multiple Choice

How can an outlier affect your data?

1

It can cause your mean to increase or decrease

2

nothing happens

3

What is an outlier?

52

Multiple Choice

Question image

Identify the outlier of the data.

1

9

2

6

3

8

4

2

53

Multiple Choice

Identify the outlier for the given data?
23, 34, 27, 7, 30, 26, 28, 31, 34
1

7

2

23

3

31

4

34

54

Multiple Choice

Question image

Is there an outlier in this data set?

1

Yes

2

No

55

Multiple Choice

Which point is the outlier?

1
2
3
4

56

Multiple Choice

What does "mean" mean?

1

average

2

middle

3

repeats the most

4

variation

​Outliers

​Clusters

​An outlier is a data point in a scatter plot that does not follow the trend of the data.

A group of data points that are closely grouped together.​

media

​outlier

cluster

Show answer

Auto Play

Slide 1 / 56

SLIDE