
Function Verbal Description
Presentation
•
Mathematics
•
8th Grade
•
Hard

Joseph Anderson
FREE Resource
21 Slides • 27 Questions
1
Functions Unit Review LESSON
Functions, Linear Functions, Writing Equations for Functions, and Comparing Functions

2
3
4
Multiple Choice
5
Functions in Graphs
Use the vertical line test, to determine if a relation is a function. If a vertical intersects the graphed image at more than one point, it is not a function.

6
Multiple Choice

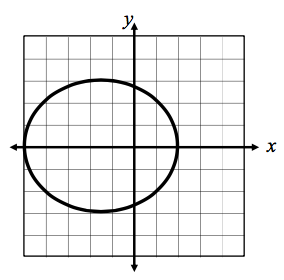
Is this graph a function or not a function?
7
Multiple Choice
8
Functions in Tables
Check the input or x values. If there are NO repeating values in the inputs, IT IS A FUNCTION.

9
Multiple Choice

10
Multiple Choice

11
Functions in Ordered Pairs
The same as a table, check the x values. If there are no repeating Xs, IT IS A FUNCTION. Each input can only have one output.

12
Multiple Choice
13
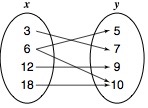
Functions in a Mapping Diagram
Check the inputs. Since each input can only have one output, each input can only be mapped to one output. (If one input has more than one line mapped to an output, it is not a function.)

14
Multiple Choice

15
Multiple Choice
16
Identifying Linear Functions in:
Equations
Graphs
Tables

17
Identifying Linear Functions in a Graph
If the graph is a straight line, it is a LINEAR function.

18
Multiple Select
19
Multiple Choice

20
Multiple Choice

Why is this function nonlinear?
21
Linear Functions in an Equation
If the equation is in the form of or can be put in the form of y = mx + b, IT IS A LINEAR FUNCTION.
x is your input
y is your output
m is your slope
b is your y intercept

22
Nonlinear Examples in Equations
*No exponent other than 1
*The variable can not be in the denominator

23
Multiple Choice

24
Multiple Choice

25
Multiple Choice
26
Linear Functions in Tables
The slope or rate of change ratios must be equivalent for every x and y in the table.

27
Multiple Choice

Why is this function linear?
28
Multiple Choice

Is this function linear or nonlinear?
29
Multiple Choice

30
Multiple Choice

31
Writing Equations of Linear Functions
From a graph, table, and word description

32
33
Writing an Equation from a table
y = mx + b
m = slope
b = y-intercept (find in the table or plug in values for x and y to solve for b)

34
35
Multiple Choice

36
Multiple Choice

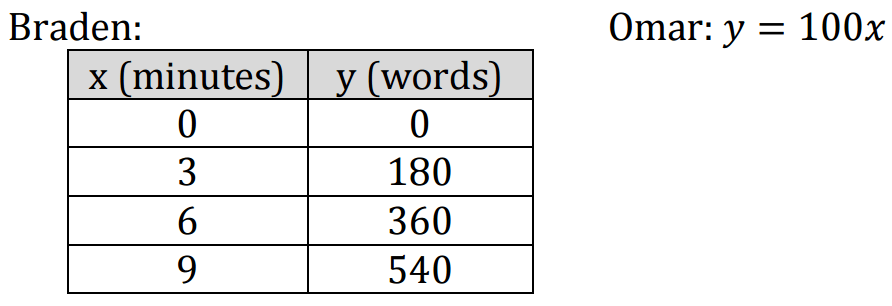
Which equation matches the table?
37
Writing Equations from a Graph
y = mx + b
1. Find slope (m)
2. Find y-intercept (b) where the graphed line crosses the y axis

38
39
Multiple Choice

40
Multiple Choice

41
Writing an Equation from a Verbal Description
*m is the slope/rate of change (look for key words: per, each, every...) happens repeatedly
*b is the y-intercept/initial value and occurs once in the problem (look for key words: starts, begins...)

42
43
Multiple Choice
44
Multiple Choice
45
Comparing Linear Functions
1. Find the slope/rate of change for each
2. Find the y-intercept/initial value for each
3. Compare

46
Multiple Choice

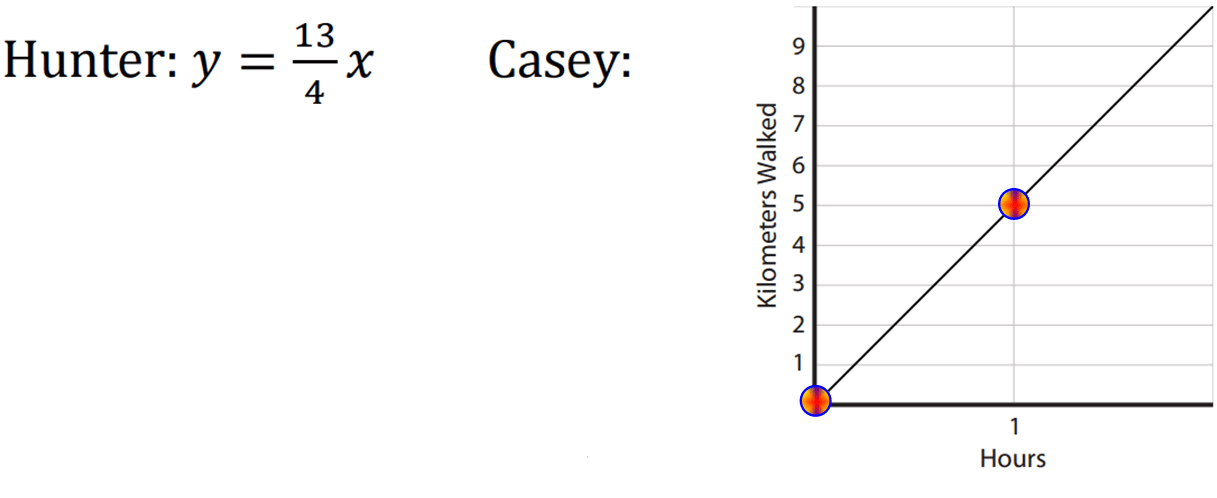
Compare the rates of change. Which statement is true about functions A and B?
47
Multiple Choice
48
Multiple Choice
Functions Unit Review LESSON
Functions, Linear Functions, Writing Equations for Functions, and Comparing Functions
Show answer
Auto Play
Slide 1 / 48
SLIDE
