
Graphing with Tables
Presentation
•
Mathematics
•
7th - 8th Grade
•
Hard
Joseph Anderson
FREE Resource
11 Slides • 21 Questions
1
R and P Review
2
Proportional Relationships

3
Characteristics of Proportional Graphs.
They are in the shape of a straight line.
They start or cross at the point of origin.
4
Multiple Choice
5
Multiple Choice
6
Multiple Choice
7
Constants & Graphs
In graphs of proportional relationships, the point (1, y) shows that `y` is the constant of proportionality.
For example, in the graph on the right, the point (1, 6) tells us that the constant of proportionality is 6.
8
Constant of Proportionality
9
Multiple Choice
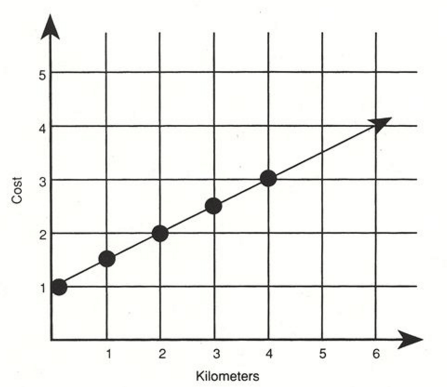
Based on the graph, what is the constant of proportionality?
1
12
24
10
Multiple Choice
What does the point (2, 12) tell us?
For 2 pounds it cost $12
It costs $2 for 12 pounds.
11
Multiple Choice
Identify the constant of proportionality.
k = 6
k = 12
k = 1/6
k = 1/12
none (not proportional)
12
Multiple Choice
Which statement matches the graph?
Taylor can write 6 words per minute
Taylor can write 25 words per minute
Taylor can write 50 words per minute
Taylor can write 150 words per minute
13
Multiple Choice
14
What is a proportional relationship?
A proportional relationship is a relationship in which the ratio between the two quantities is equivalent for all values.
The table to the right represents a proportional relationship...
15
Multiple Choice
Identify the table as proportional or non-proportional.
Proportional
Non-Proportional
16
Multiple Choice
Identify the table as proportional or non-proportional.
Proportional
Non-Proportional
17
Multiple Choice
Is the relationship between x and y proportional?
If so, what is the unit rate?
(Click on the image to make it bigger)
Yes;
31
Yes;
3
Yes;
5
No
18
Multiple Choice
The table below represents the amount of money Junior earns mowing lawns during the summer. What is the unit rate between hours and money earned?
(Click on the image to make it bigger)
$3
$4
$2
$9
19
Completing Tables using Ratios
​
20
50% is half of 100%, so take half of 4,000
21
100% divided by 10 is 10%, 4,000 divided by 10 is 400
22
5% is half of 10%, half of 400 is 200
23
24
Multiple Choice
Using the table, what is 3% of 4,000
300
120
12
34
25
Multiple Choice
Using the table, what is 9% of 4,000
900
490
360
400
26
Multiple Choice
Using the table, what percent of 4,000 is 440?
11%
9%
14%
166%
27
Multiple Choice
28
Multiple Choice
29
Multiple Choice
30
Multiple Choice
31
Multiple Choice
32
Multiple Choice
R and P Review
Show answer
Auto Play
Slide 1 / 32
SLIDE
Similar Resources on Wayground
26 questions
Scatterplots Lesson and Quiz
Presentation
•
8th Grade
24 questions
Adding and Subtracting Rational Numbers
Presentation
•
7th Grade
24 questions
Interpreting Linear Graphs
Presentation
•
8th Grade
24 questions
Notes Systems of Equations Graphing
Presentation
•
8th Grade
27 questions
Volume of Prisms
Presentation
•
7th Grade
23 questions
Volume and Surface Area Review
Presentation
•
7th Grade
25 questions
Unit 2 Review
Presentation
•
7th - 8th Grade
26 questions
Composite Figures
Presentation
•
7th Grade
Popular Resources on Wayground
10 questions
5.P.1.3 Distance/Time Graphs
Quiz
•
5th Grade
10 questions
Fire Drill
Quiz
•
2nd - 5th Grade
20 questions
Equivalent Fractions
Quiz
•
3rd Grade
22 questions
School Wide Vocab Group 1 Master
Quiz
•
6th - 8th Grade
20 questions
Main Idea and Details
Quiz
•
5th Grade
20 questions
Context Clues
Quiz
•
6th Grade
20 questions
Inferences
Quiz
•
4th Grade
12 questions
What makes Nebraska's government unique?
Quiz
•
4th - 5th Grade
Discover more resources for Mathematics
10 questions
Box Plots
Quiz
•
6th - 7th Grade
14 questions
Volume of rectangular prisms
Quiz
•
7th Grade
15 questions
Pythagorean Theorem Word Problems Quizizz
Quiz
•
8th Grade
22 questions
Simple Probability
Quiz
•
7th Grade
10 questions
U7L3 Power of Powers of 10
Quiz
•
8th Grade
20 questions
Graphing Inequalities on a Number Line
Quiz
•
6th - 9th Grade
13 questions
Area of Composite Figures
Quiz
•
7th Grade
20 questions
Scatter Plots and Line of Best Fit
Quiz
•
8th Grade