
Histograms Review
Presentation
•
Mathematics
•
9th - 11th Grade
•
Hard
Joseph Anderson
FREE Resource
9 Slides • 11 Questions
1
Histograms
Unit 6 - Statistics
Math I Honors
Mr. Johnson
2
Learning Objectives
Distinguish between histograms and bar charts
Interpret histograms and determine information from them
Assess histograms for shape, center, and spread
Develop a histogram using technology
3
Histograms are NOT Bar Charts!
Histograms can only be used to represent QUANTITATIVE data. Bar charts are only good for representing QUALITATIVE data.
4
Interpreting Histograms
ALWAYS look at the labels first!
Frequencies
"Bin" widths
Frequency Density: multiply by bin width
5
Multiple Choice
63
56
53
43
6
Shape of Histograms
Skew is easy to see in a histogram!
7
Multiple Choice
How would you describe this distribution?
Left skewed
Uniform
Right Skewed
Symmetrical
8
Multiple Choice
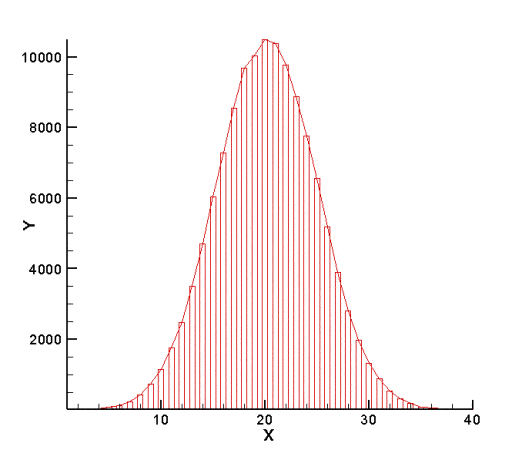
Describe the histogram:
Left Skewed
Normal/Symmetrical
Right Skewed
Uniform/Flat
9
Center of Histograms
Look for peak in your histogram!
Symmetric: peak corresponds to median AND mean
Skew: peak corresponds to median, less to mean
10
Multiple Choice
Which statement is true about the center of distribution?
The center is best described using the mean, because the distribution is skewed.
The center is best described using the median, because the distribution is skewed.
The center is best described by the mean and median, because the distribution is symmetric.
The center is best described by the outlier, because the distribution is symmetric.
11
Spread of Histograms
Range = max - min
Standard Deviation - COMPLEX formula, but technology can calculate it for us!
The higher the SD, the greater the spread
12
Multiple Choice
What is the range of ages shown in this histogram?
10 years
30 years
20 years
none of the above
13
Creating Histograms in Desmos
I will now demonstrate how to make histograms in Desmos. Afterward, we'll make a histogram from one of our class data sets and use it to answer questions.
14
Multiple Choice
Based on our class data histogram, what appears to be the approximate median hours of screen time?
0-2 hours
4-6 hours
6-8 hours
16-18 hours
15
Multiple Choice
Which best describes the shape of this histogram?
Left skewed
Symmetric
Right Skewed
16
Exit Ticket
Check your understanding of this lesson's concepts!
17
Multiple Choice
18
Multiple Choice
19
Multiple Choice
Which interval has 400 employees?
33-43
0-10
77-87
66-76
20
Dropdown
Histograms
Unit 6 - Statistics
Math I Honors
Mr. Johnson
Show answer
Auto Play
Slide 1 / 20
SLIDE
Similar Resources on Wayground
15 questions
Reviewing Simplifying Rational Expressions by Factoring
Presentation
•
9th - 12th Grade
15 questions
Trigonometry Review
Presentation
•
9th - 12th Grade
15 questions
Slope Intercept
Presentation
•
9th - 12th Grade
14 questions
Quadratic Inequalities
Presentation
•
9th - 12th Grade
16 questions
Systems of inequalities
Presentation
•
9th - 10th Grade
17 questions
Classify Polygons
Presentation
•
9th - 11th Grade
15 questions
Math 3 EOC Review
Presentation
•
9th - 12th Grade
15 questions
Arithmetic Sequences
Presentation
•
9th - 12th Grade
Popular Resources on Wayground
19 questions
Naming Polygons
Quiz
•
3rd Grade
10 questions
Prime Factorization
Quiz
•
6th Grade
20 questions
Math Review
Quiz
•
3rd Grade
15 questions
Fast food
Quiz
•
7th Grade
20 questions
Main Idea and Details
Quiz
•
5th Grade
20 questions
Context Clues
Quiz
•
6th Grade
20 questions
Inferences
Quiz
•
4th Grade
19 questions
Classifying Quadrilaterals
Quiz
•
3rd Grade
Discover more resources for Mathematics
5 questions
A.EO.1-4 Quizizz Day 1
Quiz
•
9th - 12th Grade
5 questions
A.EO.1-4 Quizizz Day 2
Quiz
•
9th - 12th Grade
20 questions
Simple Probability
Quiz
•
10th Grade
15 questions
8th Grade Math EOG Review (calculator inactive)
Quiz
•
8th - 9th Grade
20 questions
Algebra 1 Review
Quiz
•
9th Grade
30 questions
Geometry Final Exam Review
Quiz
•
10th Grade
25 questions
Algebra 1 EOC Review
Quiz
•
8th - 10th Grade
5 questions
A.EO.1-4 Quizizz Day 4
Quiz
•
9th - 12th Grade