
Interpreting Graphs, Charts, and Tables
Presentation
•
Science
•
9th - 12th Grade
•
Hard
•
NGSS
HS-ESS1-1, HS-ESS2-4, HS-LS3-3
+2
Standards-aligned

Joseph Anderson
FREE Resource
12 Slides • 25 Questions
1

2


3
Multiple Select
4


5
Multiple Choice

Which type of graph is this?
6


7
Multiple Choice
8
Multiple Choice

What type of graph is this?
9
Multiple Choice

How many more people like purple than red?
10
Multiple Choice

How many students have blue for a favorite color?
11
Multiple Choice

How many students have blue for a favorite color?
12


13
Multiple Choice

Which type of graph shows change over time?
14


15
Multiple Choice

What type of graph is this?
16
Multiple Choice

People buy more drinks on ____ than any other day.
17


18
Multiple Choice

What type of graph is this?
19
Multiple Choice

A pie chart allows you to easily see
20


21
Multiple Choice

The team scored 50 points. How many points did Kendrick score?
22
Multiple Choice
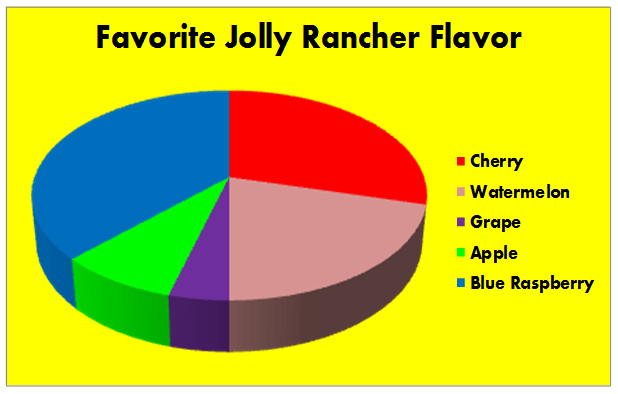
According to this graph, what is the most popular flavor of Jolly Rancher?
23
Multiple Choice

308 people were surveyed about how they got to school. How many ride their bike?
24


25
Multiple Choice

What is this?
26


27


28

29
Multiple Choice
30
Multiple Choice
31
Multiple Choice
32
Multiple Choice
33
Multiple Choice
34
Multiple Choice
35
Multiple Choice
36
Multiple Choice
37
Multiple Choice
Show answer
Auto Play
Slide 1 / 37
SLIDE
