Search Header Logo
Review Math Unit One-Variable Inequalities

Review Math Unit One-Variable Inequalities

Assessment

Presentation

Mathematics

9th - 12th Grade

Hard

Created by

Joseph Anderson

FREE Resource

9 Slides • 19 Questions

1

Solving Inequalities is like Solving Equations

  • Distribute First

  • Get Like Terms together

  • Do Opposite Operations

  • BUT... If you divide or multiply by a NEGATIVE NUMBER you must flip the inequalitiy sign

2

Multiple Choice

Does the sign need to flip when solving?
-2x ≥ 22
1
YES
2
NO

3

Multiple Choice

Solve
-5m < 10
1
m < -2
2
m > -2
3
m < -50
4
m > -50

4

Multiple Choice

Does the sign need to flip when solving?

m - 5 > 8

1

YES

2

NO

5

Multiple Choice

Solve for t.

6t 
4 ≤ -2
1
t ≤ -1 
2
t ≤ 1
3
t=1
4
1=t

6

Graphing Inequalities

media

7

Multiple Choice

When graphing an inequality, you use an open dot when you use which symbol?
1
<, >
2
≤, ≥ 
3
≤, <
4
≥, >

8

Multiple Choice

When you graph an inequality, you used a closed dot when you use which symbols?
1
≤, ≥ 
2
<, >
3
≤, <
4
≥, >

9

Multiple Choice

"At most" and "No more than" are both clue words for...
1
<
2
>
3
4

10

Multiple Choice

Question image
Match the graph with its inequality.
1
b > –2
2
b < –2
3
b ≥ –2
4
b ≤ –2

11

Multiple Choice

Question image
Match the graph with its inequality.
1
c > 9
2
c < 9
3
c ≥ 9
4
c ≤ 9

12

Multiple Choice

Question image

Match the graph with its inequality.

1

a > 11

2

a < 11

3

a ≥ 11

4

a ≤ 11

13

Multiple Choice

Which sentence represents m > 41?
1
Mary’s points, m, totaled more than 41
2
Calvin ran no less than 41 miles, m
3
The temperature, m, was less than 41°F
4
The magazines’ cost, m, was not more than $41.

14

Graphing Linear Inequalities

media

15

media

16

Multiple Choice

How would you graph the following linear inequality?

y ≥ 4

1

Dashed line, shade above

2

Dashed line, shade below

3

Solid line, shade above

4

Solid line, shade below

17

Multiple Choice

How would you graph the following linear inequality?

y  43x  4y\ ≤\ \frac{4}{3}x\ -\ 4  

1

Dashed line, shade above

2

Dashed line, shade below

3

Solid line, shade above

4

Solid line, shade below

18

Graphing Linear Inequalities is the same as graphing lines.


With the addition of shading above or below. We also have check if it is dotted or solid.

19

media

20

21

Multiple Choice

When graphing an inequality, you use a dotted line when you use which symbol?

1

<, >

2

≤, ≥

22

Multiple Choice

When you graph an inequality, you use a solid line when you use which symbols?

1

≤, ≥

2

<, >

23

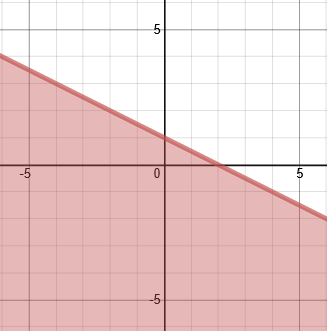
What are the solutions to a linear equality?

  • Any point (x,y) that satisfies the inequality (makes it true)

  • Any point (x,y) that is in the SHADED region when the inequality is graphed.

  • Any point (x,y) that is ON THE LINE when the line is a SOLID LINE.

  • Any points ON a dotted line are NOT solutions.

media

24

media

25

Multiple Select

Question image

Which point(s) are solutions to the inequality shown on the graph? Select all that apply.

1

(0,5)

2

(-2,2)

3

(-3,4)

4

(-1,1)

5

(-4,0)

26

Multiple Select

Question image

Which point(s) are solutions to the inequality shown on the graph? Select all that apply.

1

(-4,3)

2

(1,3)

3

(4,-5)

4

(1,-5)

5

(-3,-5)

27

Multiple Choice

Question image
Are the points on the boundary line part of the solution set or not?
1

Yes, they are part of the solution set

2

No, they are NOT part of the solution set

28

Multiple Choice

How can I tell if an inequality will have a solid line?
1

It has an equal sign.

2

The symbol is greater than.

3

The symbol has "or equal to."

4

You just guess.

Solving Inequalities is like Solving Equations

  • Distribute First

  • Get Like Terms together

  • Do Opposite Operations

  • BUT... If you divide or multiply by a NEGATIVE NUMBER you must flip the inequalitiy sign

Show answer

Auto Play

Slide 1 / 28

SLIDE